MACD, Supertrend and moving-average crosses: what happened next
Jordan Ellis
Senior Product Marketing Manager, CoinBeacon
Trend signals are meant to say that a move has started and may carry on. This is what crypto prices did in the week after the four most common ones, across about 800 coins on five exchanges over six months, measured from CoinBeacon’s Indicator Edge.
The four signals
- A MACD cross is two averages changing order. The MACD line is the gap between a 12-candle and a 26-candle average of price, and the signal line is a 9-candle average of that gap. A bullish cross is the MACD line moving above the signal line; a bearish cross is the reverse.
- A Supertrend flip is price breaking through a trailing line. Supertrend draws a line a set distance from price: three times the average range of the last 10 candles. It flips to bullish when price closes above the line, and to bearish when price closes below it.
- A golden cross is the 50-candle average rising above the 200-candle one. A death cross is the 50 falling below the 200. Both use simple averages of the close. On the 4-hour chart that is about eight days crossing about 33 days.
- An EMA200 cross is the price itself crossing the 200-candle average. The exponential average gives recent candles more weight, so it turns sooner than the simple one.
Each is measured the way the RSI guide explains: a signal is a cross between two closed candles, the outcome is the close seven days later against the close of the candle that fired, and every figure sits next to an ordinary week for the same coins. The signals come from the 180 days to 15 October 2026 on Binance spot and the Binance, Bybit, OKX and Gate.io perpetual futures, and a coin on several exchanges counts once per exchange.
On the 4-hour chart
| Signal | Signals (coins) | Median move | Ended higher |
|---|---|---|---|
| MACD crossed above signal | 75,033 (800) | −0.82% | 45.4% |
| MACD crossed below signal | 74,994 (799) | −1.01% | 45.0% |
| Supertrend flipped bullish | 22,570 (774) | −1.17% | 45.0% |
| Supertrend flipped bearish | 24,079 (773) | −0.64% | 46.8% |
| Golden cross (SMA50 above SMA200) | 6,028 (647) | −1.20% | 43.1% |
| Death cross (SMA50 below SMA200) | 5,652 (640) | +0.13% | 51.2% |
| Price crossed above EMA200 | 46,837 (678) | −0.05% | 48.9% |
| Price crossed below EMA200 | 48,482 (676) | −0.12% | 48.7% |
| An ordinary week | every candle | −1.04% | 45.1% |
On the 4-hour chart, every signal was followed by a week within about one percentage point of an ordinary week. After a MACD cross up, the median week ended 0.82% lower; after a cross down, 1.01% lower, against 1.04% for an ordinary week. The golden and death crosses differed most: a median of −1.20% after a golden cross and +0.13% after a death cross, the only signal followed by a median gain, with 51.2% of death crosses followed by a higher close.
The signals also differ hugely in how often they fire. There were 75,033 bullish MACD crosses in six months, against 6,028 golden crosses.
On the daily chart
| Signal | Signals (coins) | Median move | Ended higher |
|---|---|---|---|
| MACD crossed above signal | 11,433 (636) | −0.58% | 47.0% |
| MACD crossed below signal | 12,481 (634) | +0.12% | 50.9% |
| Supertrend flipped bullish | 3,279 (572) | −2.48% | 41.5% |
| Supertrend flipped bearish | 2,720 (525) | −0.92% | 43.6% |
| Golden cross (SMA50 above SMA200) | 1,267 (317) | −3.11% | 39.9% |
| Death cross (SMA50 below SMA200) | 477 (141) | +0.85% | 57.7% |
| Price crossed above EMA200 | 3,679 (412) | −1.38% | 42.2% |
| Price crossed below EMA200 | 3,332 (370) | −0.05% | 48.5% |
| An ordinary week | every candle | −2.00% | 42.3% |
On the daily chart the pattern was sharper: for every pair, the bearish signal was followed by a better week than the bullish one. After a death cross, the median week ended 0.85% higher and 57.7% of signals ended higher. After a golden cross, it ended 3.11% lower and 39.9% ended higher, against an ordinary week’s 2.00% fall and 42.3%. The death cross is also the smallest sample here: 477 signals on 141 coins.
Why a trend signal can point the wrong way
Moving averages, MACD and Supertrend are all calculated from past candles, so they confirm a move after it has been under way for a while. A golden cross on the daily chart needs weeks of rising prices before the 50-day average overtakes the 200-day one. When a move carries on, a late confirmation still catches part of it; when prices keep reversing, the confirmation arrives near the end of the move.
The daily table above fits the second case. That describes this stretch of market, in which the typical coin spent more weeks falling than rising. It is not a permanent rule, and the same measurement over a rising year could read the other way.
Checking a coin and setting an alert
In Indicator Edge, pick MACD crossed above signal, Supertrend flipped bullish, SMA50 crossed above SMA200, Price crossed above EMA200 or any of their bearish twins in the Signal menu, then the chart timeframe and the outcome window. The board ranks coins by how the weeks after that signal compare with their own ordinary weeks, and flags fewer than 20 independent signals as a Small sample.
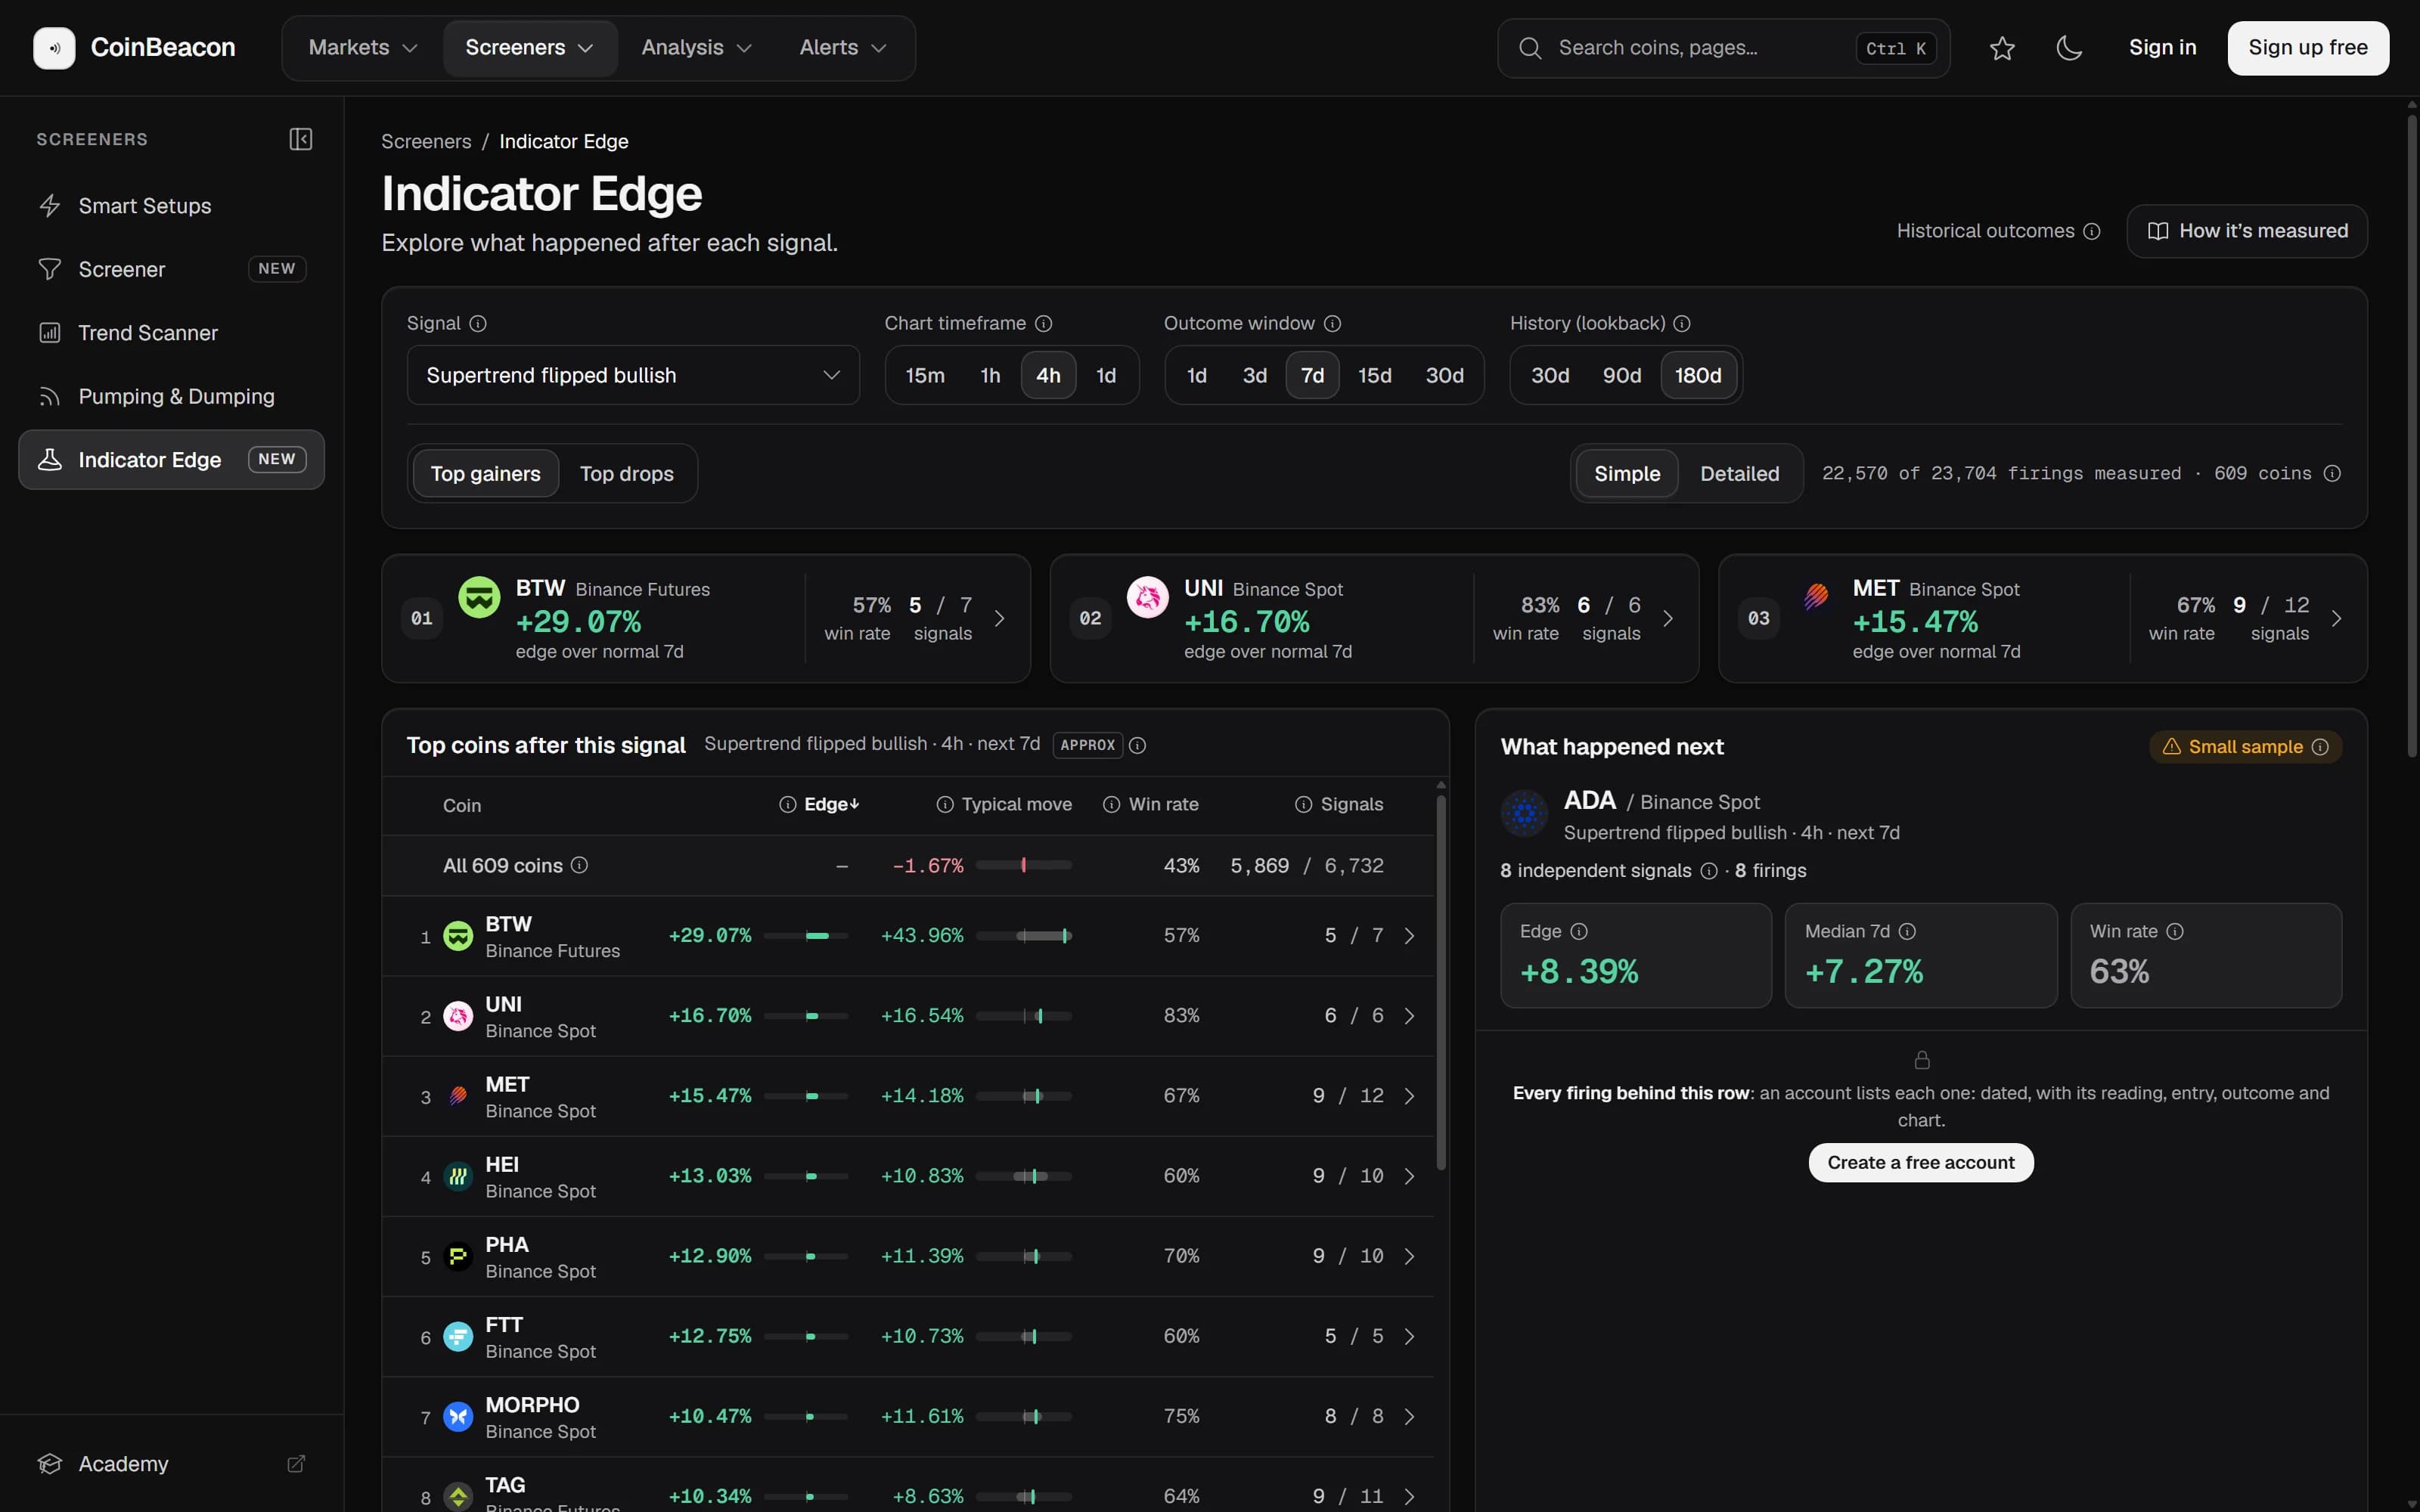
The board marks the Supertrend and EMA200 signals Approx. Both indicators carry state forward from the first candle they were computed on, so a reading rebuilt from history can differ slightly from the live one on the same candle. Treat those two as close, not exact.
To be told when one of these happens on a coin you follow, the app has MACD alerts (crosses of the signal line or the zero line), Supertrend alerts (flips either way) and EMA alerts (one EMA crossing another, or price crossing an EMA). The EMA alert’s golden cross uses exponential averages, so it fires at a different moment from the simple-average golden cross measured here. All three check every minute and read the newest candle, including one that has not closed yet, while Indicator Edge counts only crosses on closed candles.