RSI overbought and oversold in crypto: what happened next
Jordan Ellis
Senior Product Marketing Manager, CoinBeacon
RSI above 70 is called overbought and RSI below 30 oversold, and both are usually read as a sign that a move has gone too far. This is what crypto prices actually did in the week after each, across 737 coins on five exchanges over six months, measured from CoinBeacon’s Indicator Edge.
What was measured
RSI, the relative strength index, compares the size of recent rising candles with recent falling ones and puts the result on a scale from 0 to 100. Indicator Edge uses the standard 14-candle RSI and records a signal each time it crosses a level between two closed candles: below 30, 25, 20 or 15, or above 70, 75, 80 or 85.
For every signal it records where the price closed a set time later, against the close of the candle that fired. The first two tables use the 4-hour chart and the close seven days later, over the 180 days to 15 October 2026, on Binance spot and the Binance, Bybit, OKX and Gate.io perpetual futures.
- A level has to be left before it counts again. After RSI crosses below 30, the next cross below 30 counts only once RSI has been back above 40 and at least five candles have passed, so one long oversold stretch is one signal, not thirty.
- Each exchange counts separately. A coin listed on three of the five exchanges can fire three times on the same candle. The tables count signals, with the number of different coins beside them.
- The median, not the average. Half the signals ended above the median and half below it. One coin that doubled cannot move it much, which it could do to an average.
Every figure sits next to an ordinary week for the same coins: the move over seven days from any 4-hour candle, whether RSI had crossed anything or not. Without it, a fall after a signal tells you nothing, because in these months most weeks ended lower anyway.
After RSI crossed below 30
| Signal | Signals (coins) | Median move | Ended higher |
|---|---|---|---|
| RSI crossed below 30 | 15,454 (737) | −0.99% | 45.0% |
| RSI crossed below 25 | 6,187 (654) | −0.62% | 46.4% |
| RSI crossed below 20 | 1,641 (381) | −0.47% | 48.1% |
| RSI crossed below 15 | 345 (123) | 0.00% | 49.6% |
| An ordinary week | every candle | −1.04% | 45.1% |
The week after RSI crossed below 30 looked almost exactly like an ordinary week for these coins. The median signal was followed by a 0.99% fall, against 1.04% for an ordinary week, and 45.0% of signals ended the week higher, against 45.1%.
Deeper oversold readings came closer to an even split, with 48.1% ending higher after a cross below 20 and 49.6% after a cross below 15, but none of them was followed by a median gain. They are also much rarer: 345 signals crossed below 15 in six months, against 15,454 below 30.
After RSI crossed above 70
| Signal | Signals (coins) | Median move | Ended higher |
|---|---|---|---|
| RSI crossed above 70 | 18,968 (734) | −2.06% | 43.4% |
| RSI crossed above 75 | 10,730 (689) | −2.43% | 42.5% |
| RSI crossed above 80 | 5,480 (636) | −3.15% | 39.8% |
| RSI crossed above 85 | 2,567 (504) | −5.12% | 35.6% |
| An ordinary week | every candle | −1.04% | 45.1% |
Crossing above 70 was followed by a weaker week than usual, and each higher level by a weaker week still. After a cross above 85, the median week ended 5.12% lower, against 1.04% for an ordinary week, and 35.6% of signals ended higher.
Put the other way round: in these six months, a coin pushed above 85 on the 4-hour chart closed lower a week later 64.4% of the time. The tables do not say how far it fell in between: the outcome is the close seven days later, not the low along the way.
On the daily and hourly charts
The same signals on other charts gave a different picture, which is a reason to check the chart you actually trade.
| Signal | Signals (coins) | Median move | Ended higher |
|---|---|---|---|
| RSI crossed below 30 | 2,342 (419) | −1.52% | 42.4% |
| RSI crossed below 25 | 1,207 (264) | +1.07% | 56.2% |
| RSI crossed below 20 | 319 (99) | +2.18% | 60.5% |
| RSI crossed below 15 | 47 (20) | +5.25% | 66.0% |
| RSI crossed above 70 | 3,940 (516) | −4.51% | 34.3% |
| RSI crossed above 85 | 500 (126) | −8.28% | 28.0% |
| An ordinary week | every candle | −2.00% | 42.3% |
On the daily chart, deep oversold crosses were followed by better weeks than usual. After a cross below 20, the median week ended 2.18% higher and 60.5% of signals ended higher, against an ordinary week’s 2.00% fall and 42.3%. These samples are small: 319 signals on 99 coins below 20, and 47 signals on 20 coins below 15, few enough that a single market-wide rebound can decide the result. Overbought crosses on the daily chart were followed by weaker weeks than on the 4-hour: 28.0% ended higher after a cross above 85.
On the hourly chart, measured over the following day, the differences were smaller. After RSI crossed below 30, the next day ended higher 54.0% of the time with a median of +0.33%, against 50.2% and +0.03% for an ordinary day. After a cross above 70, 41.8% ended higher, with a median of −0.77%.
How to read these numbers
- They describe one stretch of market. The 180 days to 15 October 2026, in which the typical coin spent more weeks falling than rising. In a rising market every row would move, the ordinary week included.
- Signals arrive in crowds. When the whole market drops, hundreds of coins cross 30 within the same few hours, and the week that follows is one market event counted hundreds of times. Six months hold far fewer independent events than the signal counts suggest.
- A median hides the spread. Half the signals did better than the median and half did worse, often by a wide margin. Indicator Edge shows each coin’s range.
- The past is not a forecast. These are measurements of what followed, not a rule that it will happen again, and none of it is advice to buy or sell.
Look up a coin in Indicator Edge
Indicator Edge, under Screeners in the app, runs the same measurement for each coin separately and ranks them. To check a coin, or to rebuild the tables above:
- Pick the signal. Choose RSI crossed below 30, or any of the 19 signals, in the Signal menu.
- Set the chart, the outcome and the history. Chart timeframe 4h, Outcome window 7d and History 180d match the first two tables. The page opens on 90 days.
- Read the ranking. A coin’s Edge is its median move after the signal minus its own ordinary move over the same window, shown as edge over normal. Win rate is the share of signals that ended higher. Signals shows the independent signals, with overlapping outcome windows counted once, then every firing.
- Open a coin. What happened next shows that coin’s figures and marks fewer than 20 independent signals as a Small sample: five signals are too few to tell a pattern from chance.
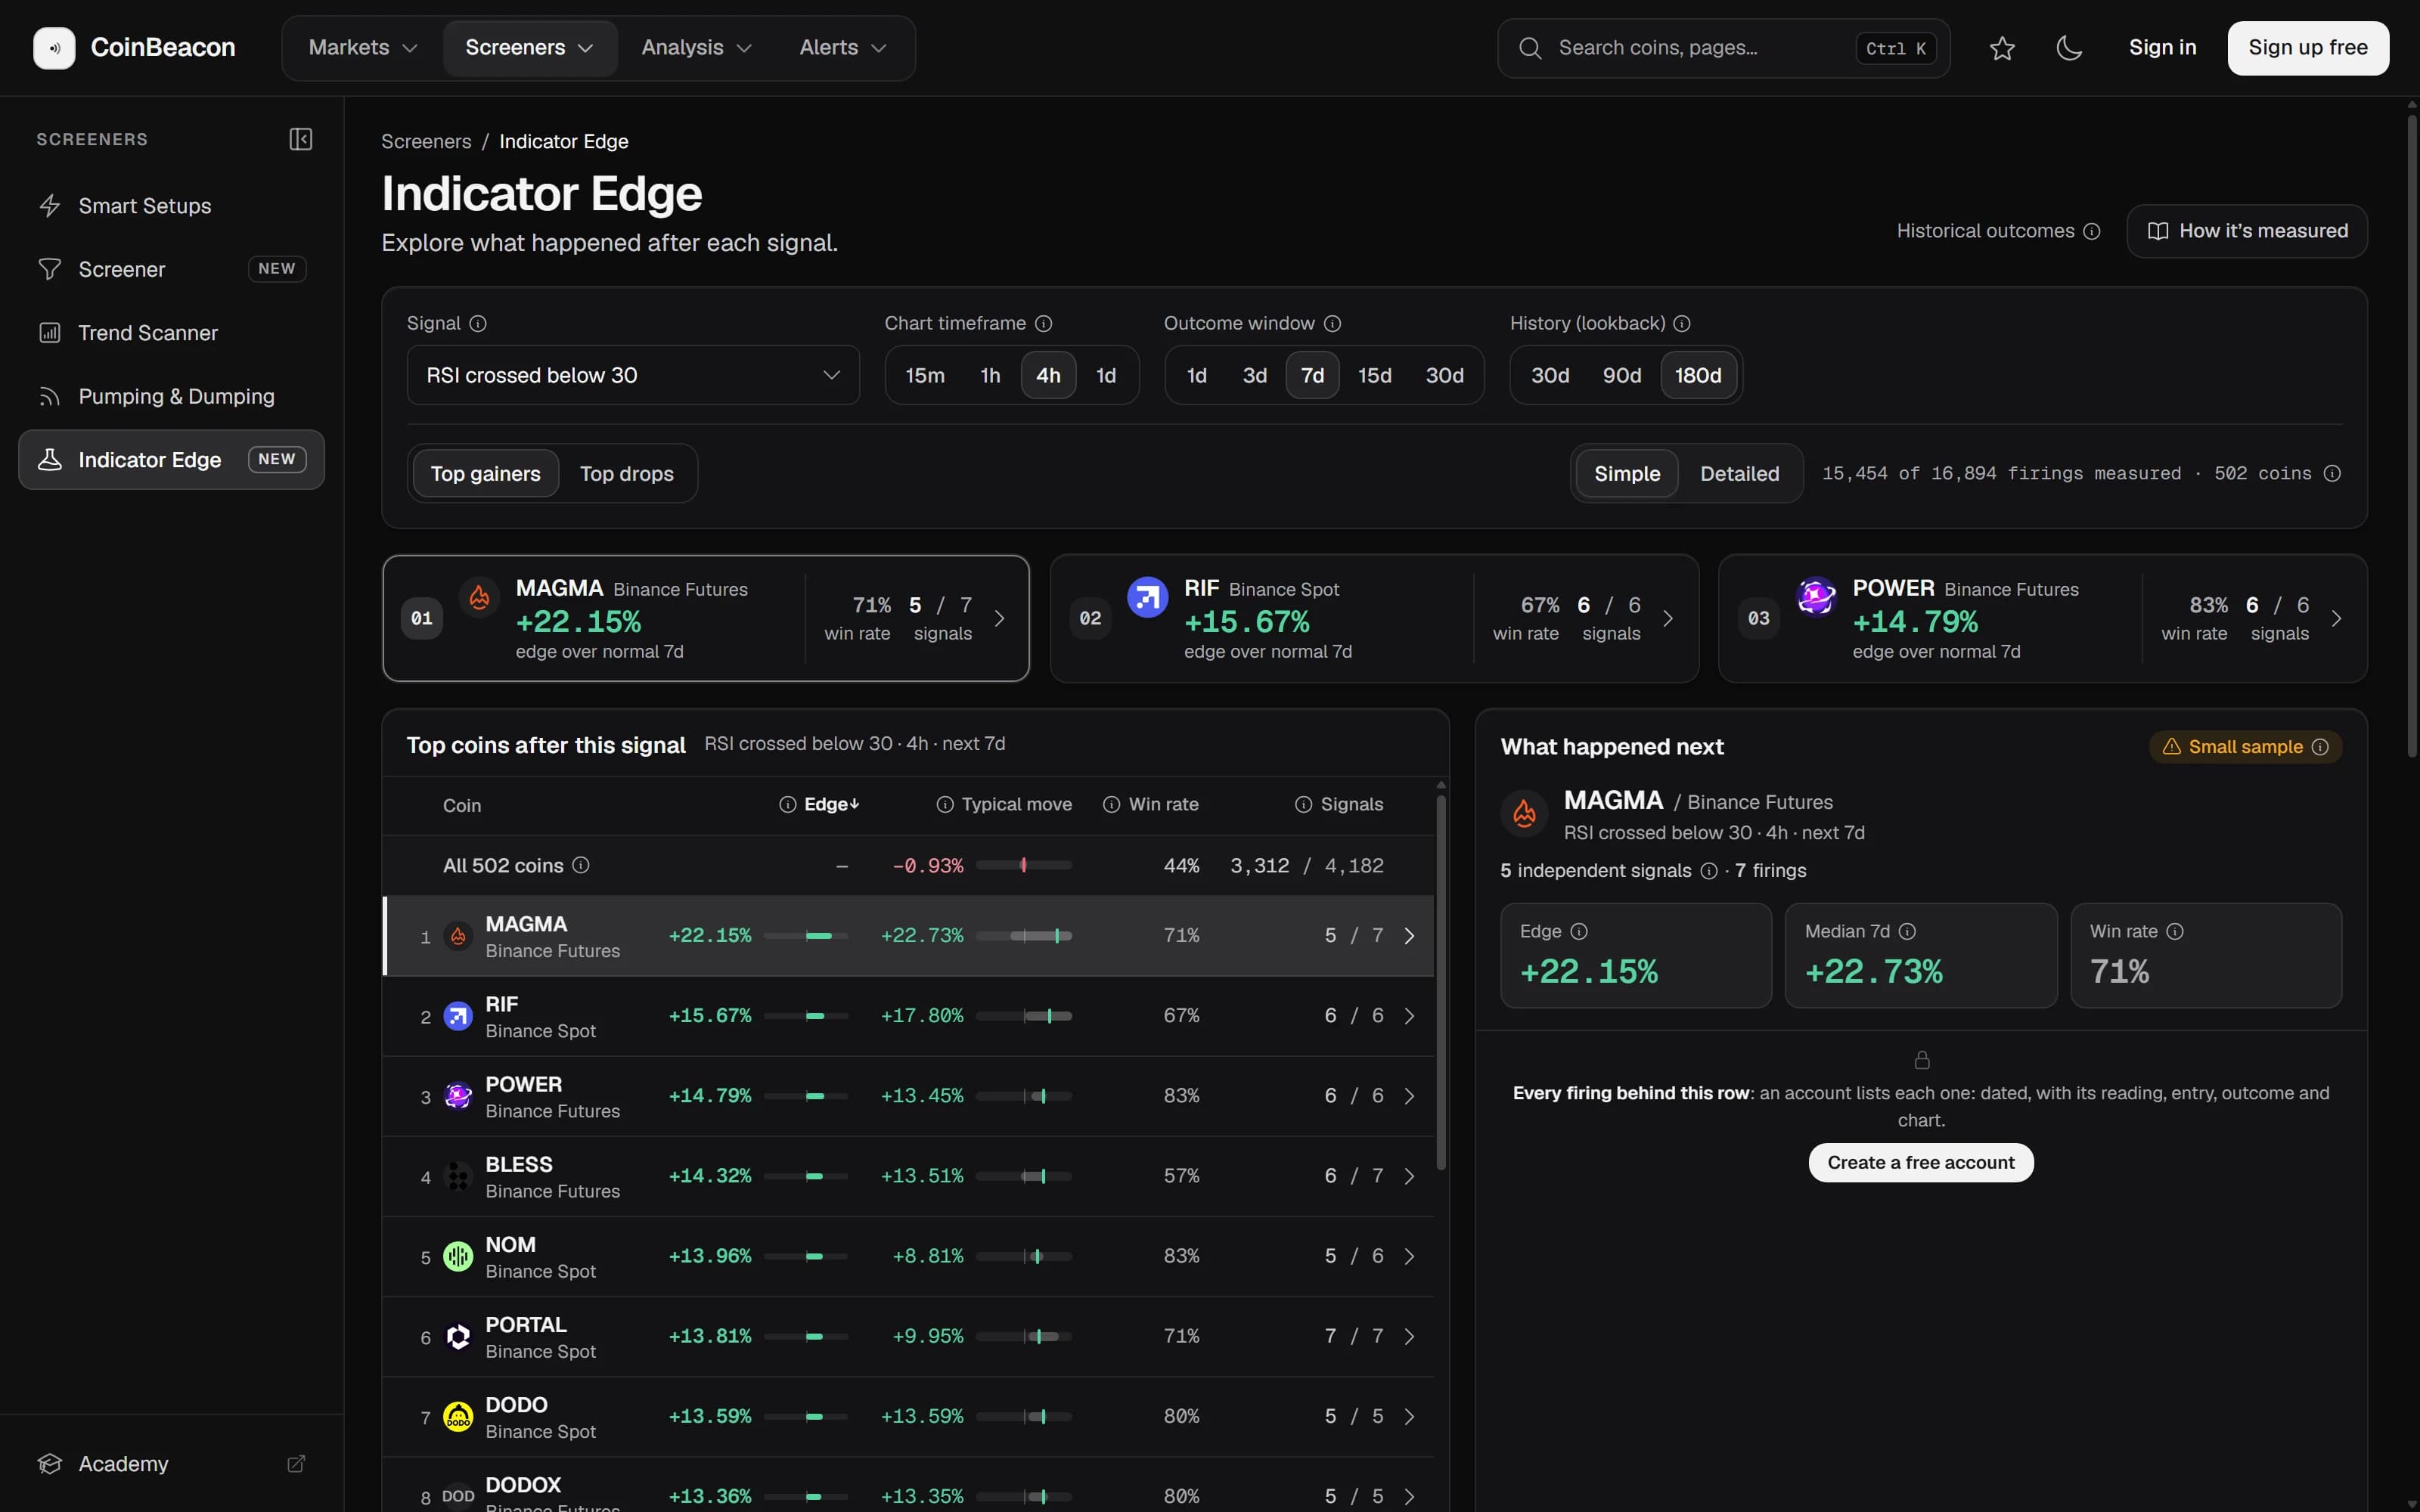
The board ranks only coins with at least five independent signals in the chosen history, so its All coins row covers a smaller group than the tables above, which count every signal on every coin. Signed out, you see the top 20 coins for any setting. A free account opens the full board and lists every firing behind a row: the date, the RSI reading, the entry price, the outcome and a chart.
Get an alert when RSI crosses a level
An RSI alert watches one coin and messages you when its 14-candle RSI crosses a level you choose.
- Pick the coin and the chart. Search the coin, choose the exchange, and pick a timeframe from 1 minute to 4 hours.
- Choose the direction and the level. Crosses below or Crosses above, and a level from 0 to 100. The Oversold < 30 and Overbought > 70 presets fill in the usual levels.
- Pick where it reaches you. Email, Telegram, Discord or a webhook. The channels guide shows how to connect each one.
The alert checks every minute and reads the newest candle, including one that has not closed yet, so it can fire on a cross that the close later undoes; Indicator Edge counts only crosses on closed candles. After firing, the alert waits until RSI has left the zone before it can fire again. To watch every coin on an exchange instead of one, use Scan all coins with RSI.
For trend signals measured the same way, see what happened after MACD, Supertrend and moving-average crosses.