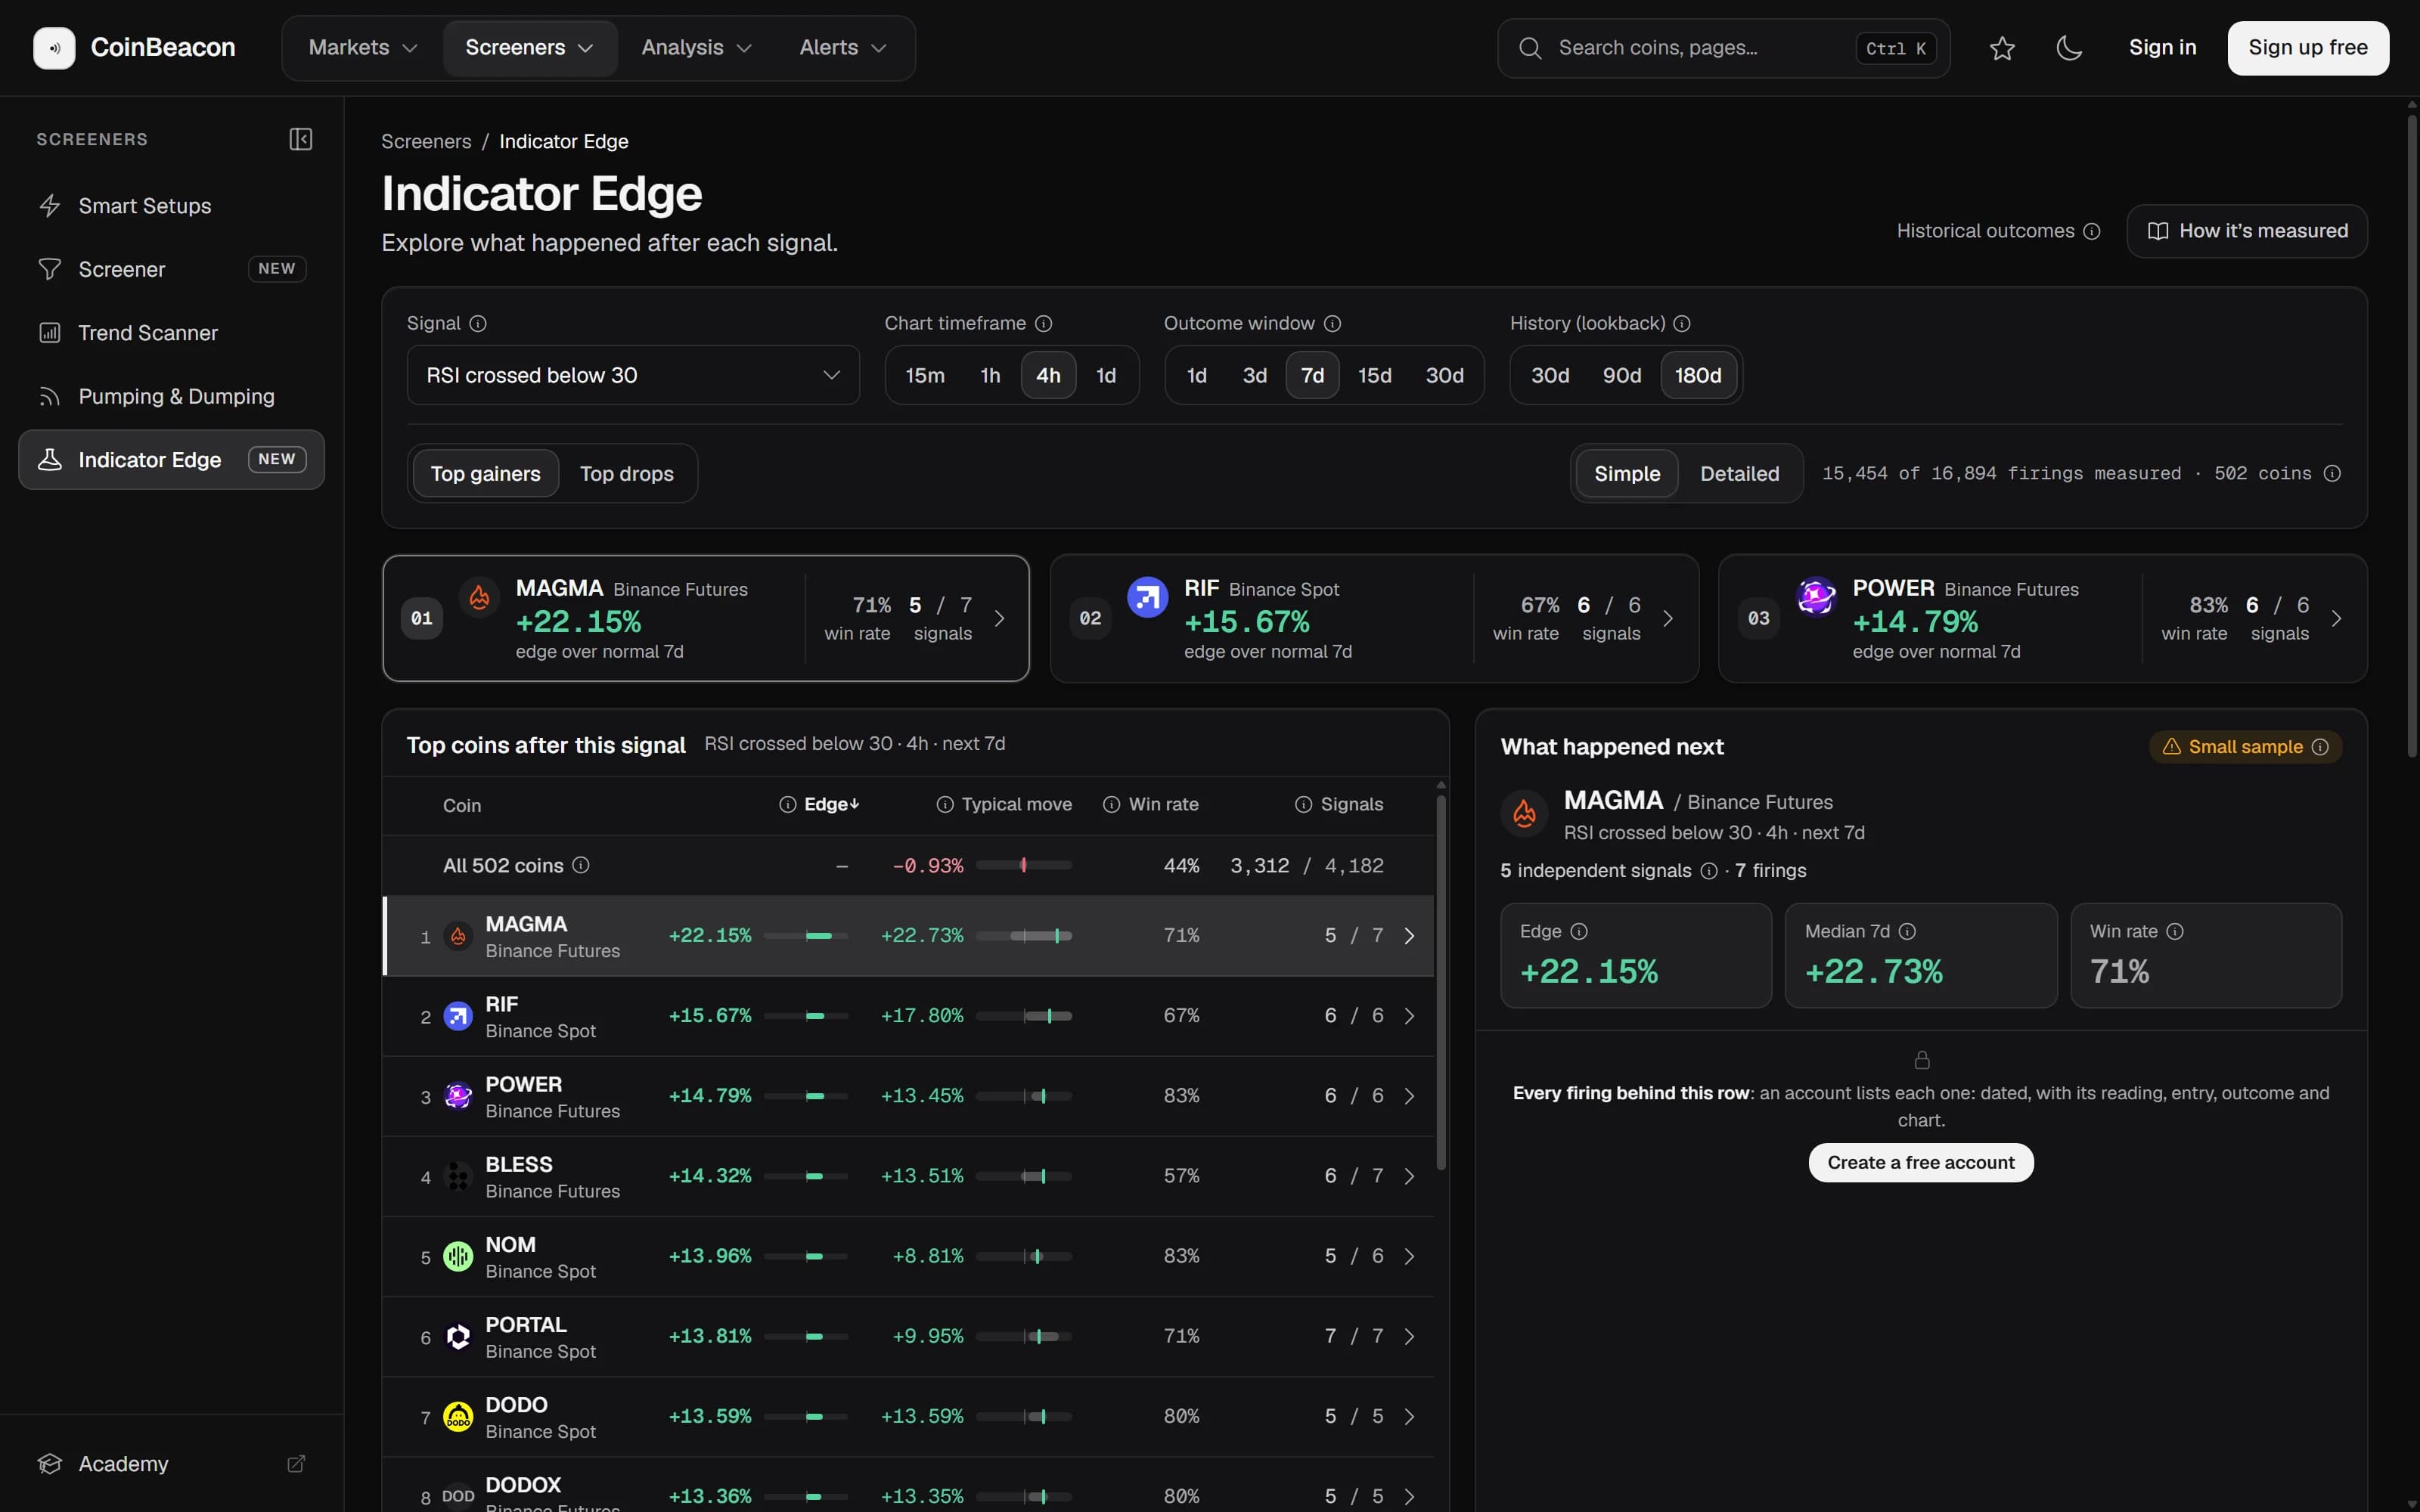
RSI overbought and oversold in crypto: what happened next
What crypto prices did in the week after RSI crossed 30 or 70, on 737 coins over six months, set against an ordinary week, and how to check any coin.
What prices did after RSI, MACD, Supertrend, moving-average, Bollinger and volume signals on hundreds of coins, measured from CoinBeacon's Indicator Edge.
What crypto prices did in the week after RSI crossed 30 or 70, on 737 coins over six months, set against an ordinary week, and how to check any coin.
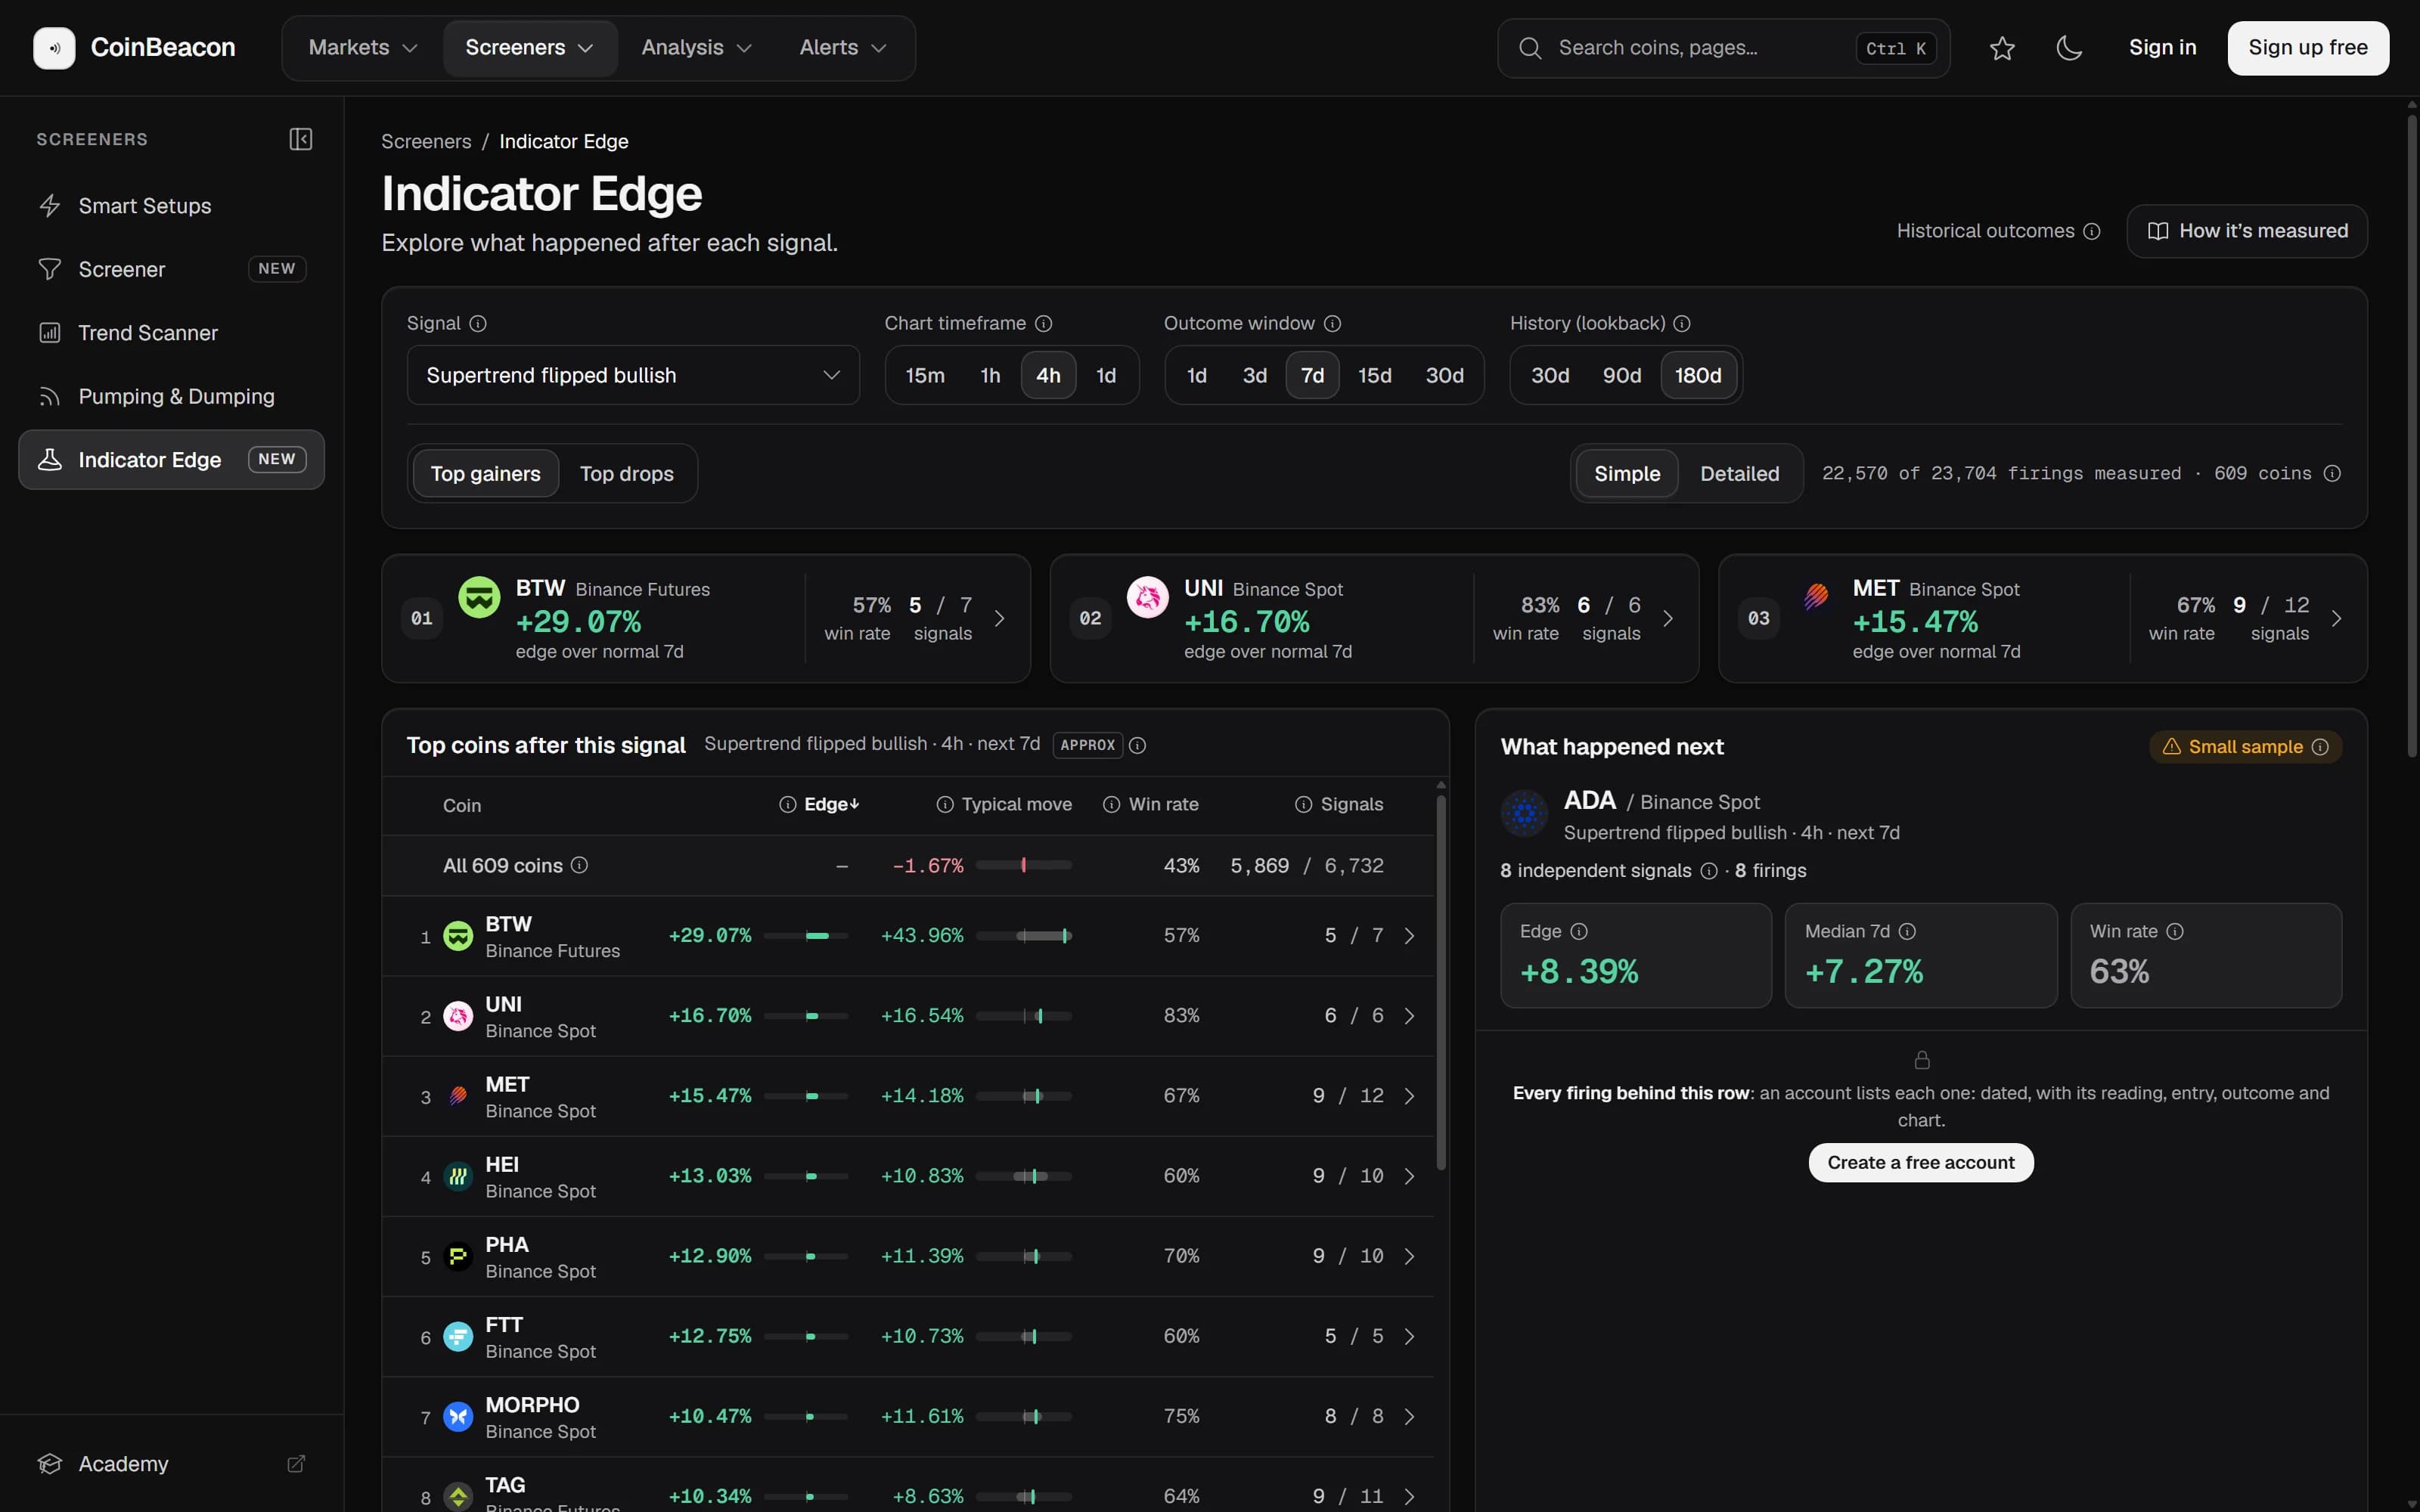
The week after MACD crosses, Supertrend flips, golden and death crosses and EMA200 breaks, measured on about 800 coins and set against an ordinary week.
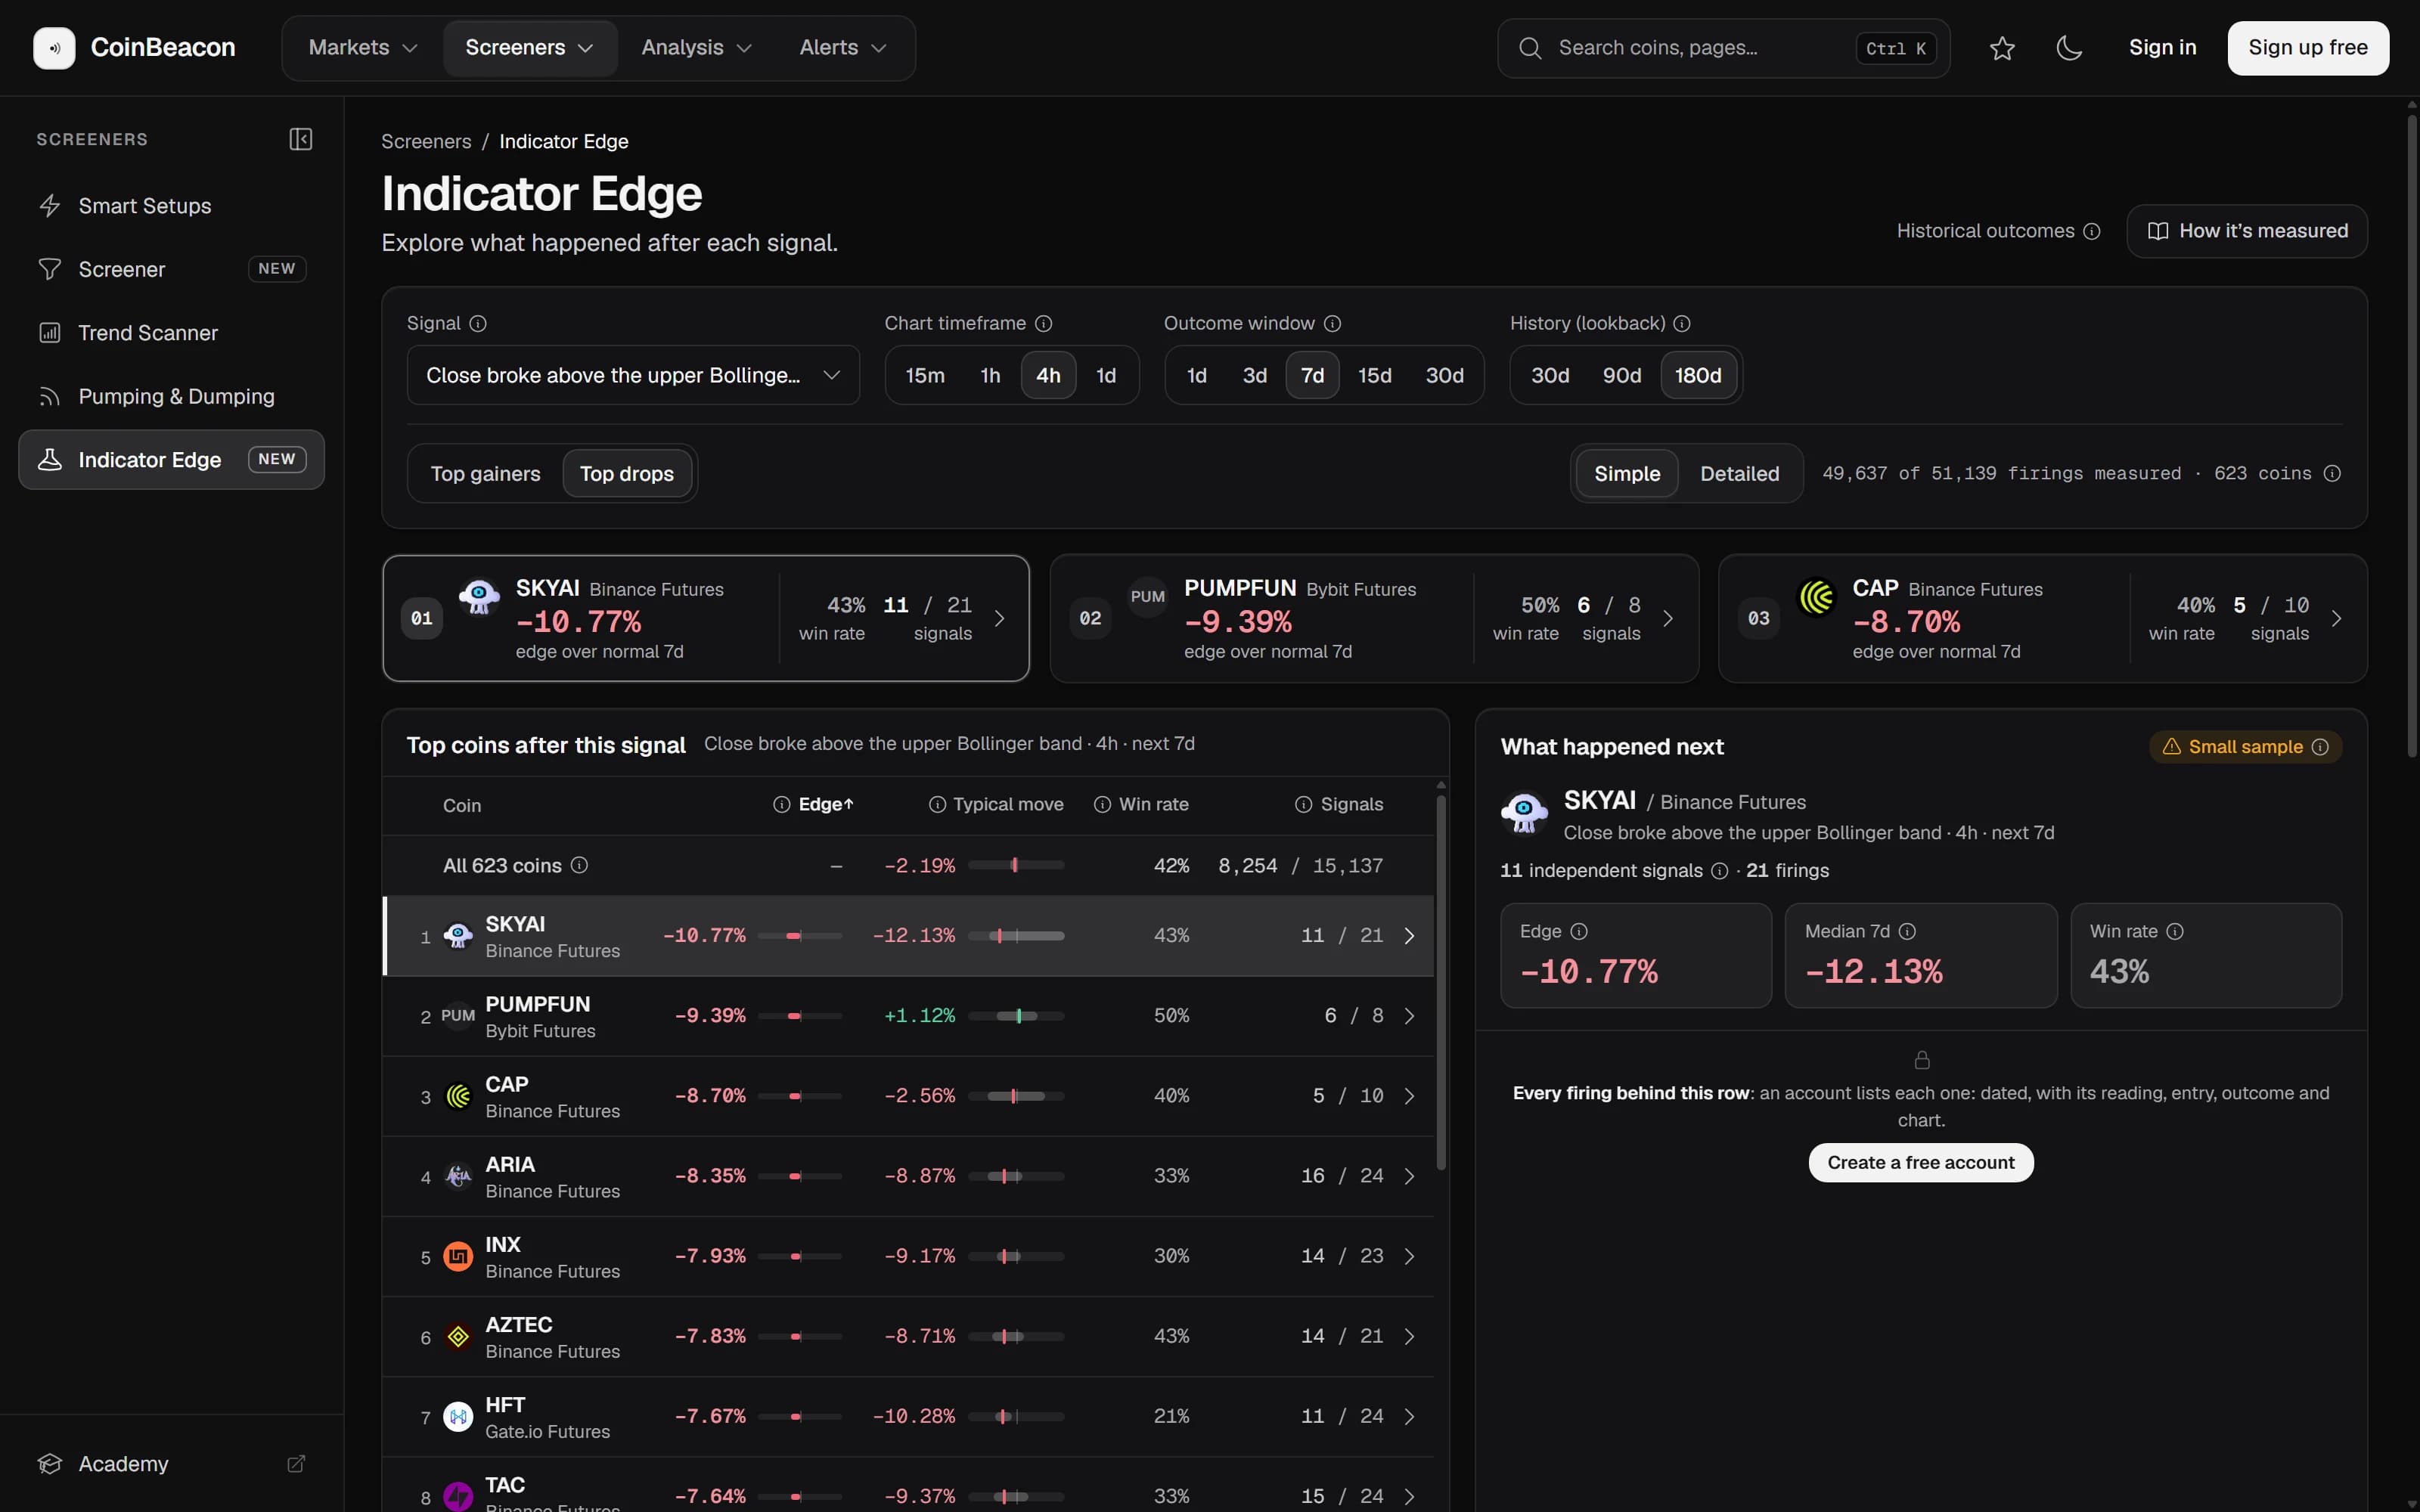
What crypto prices did after a candle closed outside its Bollinger Bands, on about 800 coins over six months, with and without a volume spike.
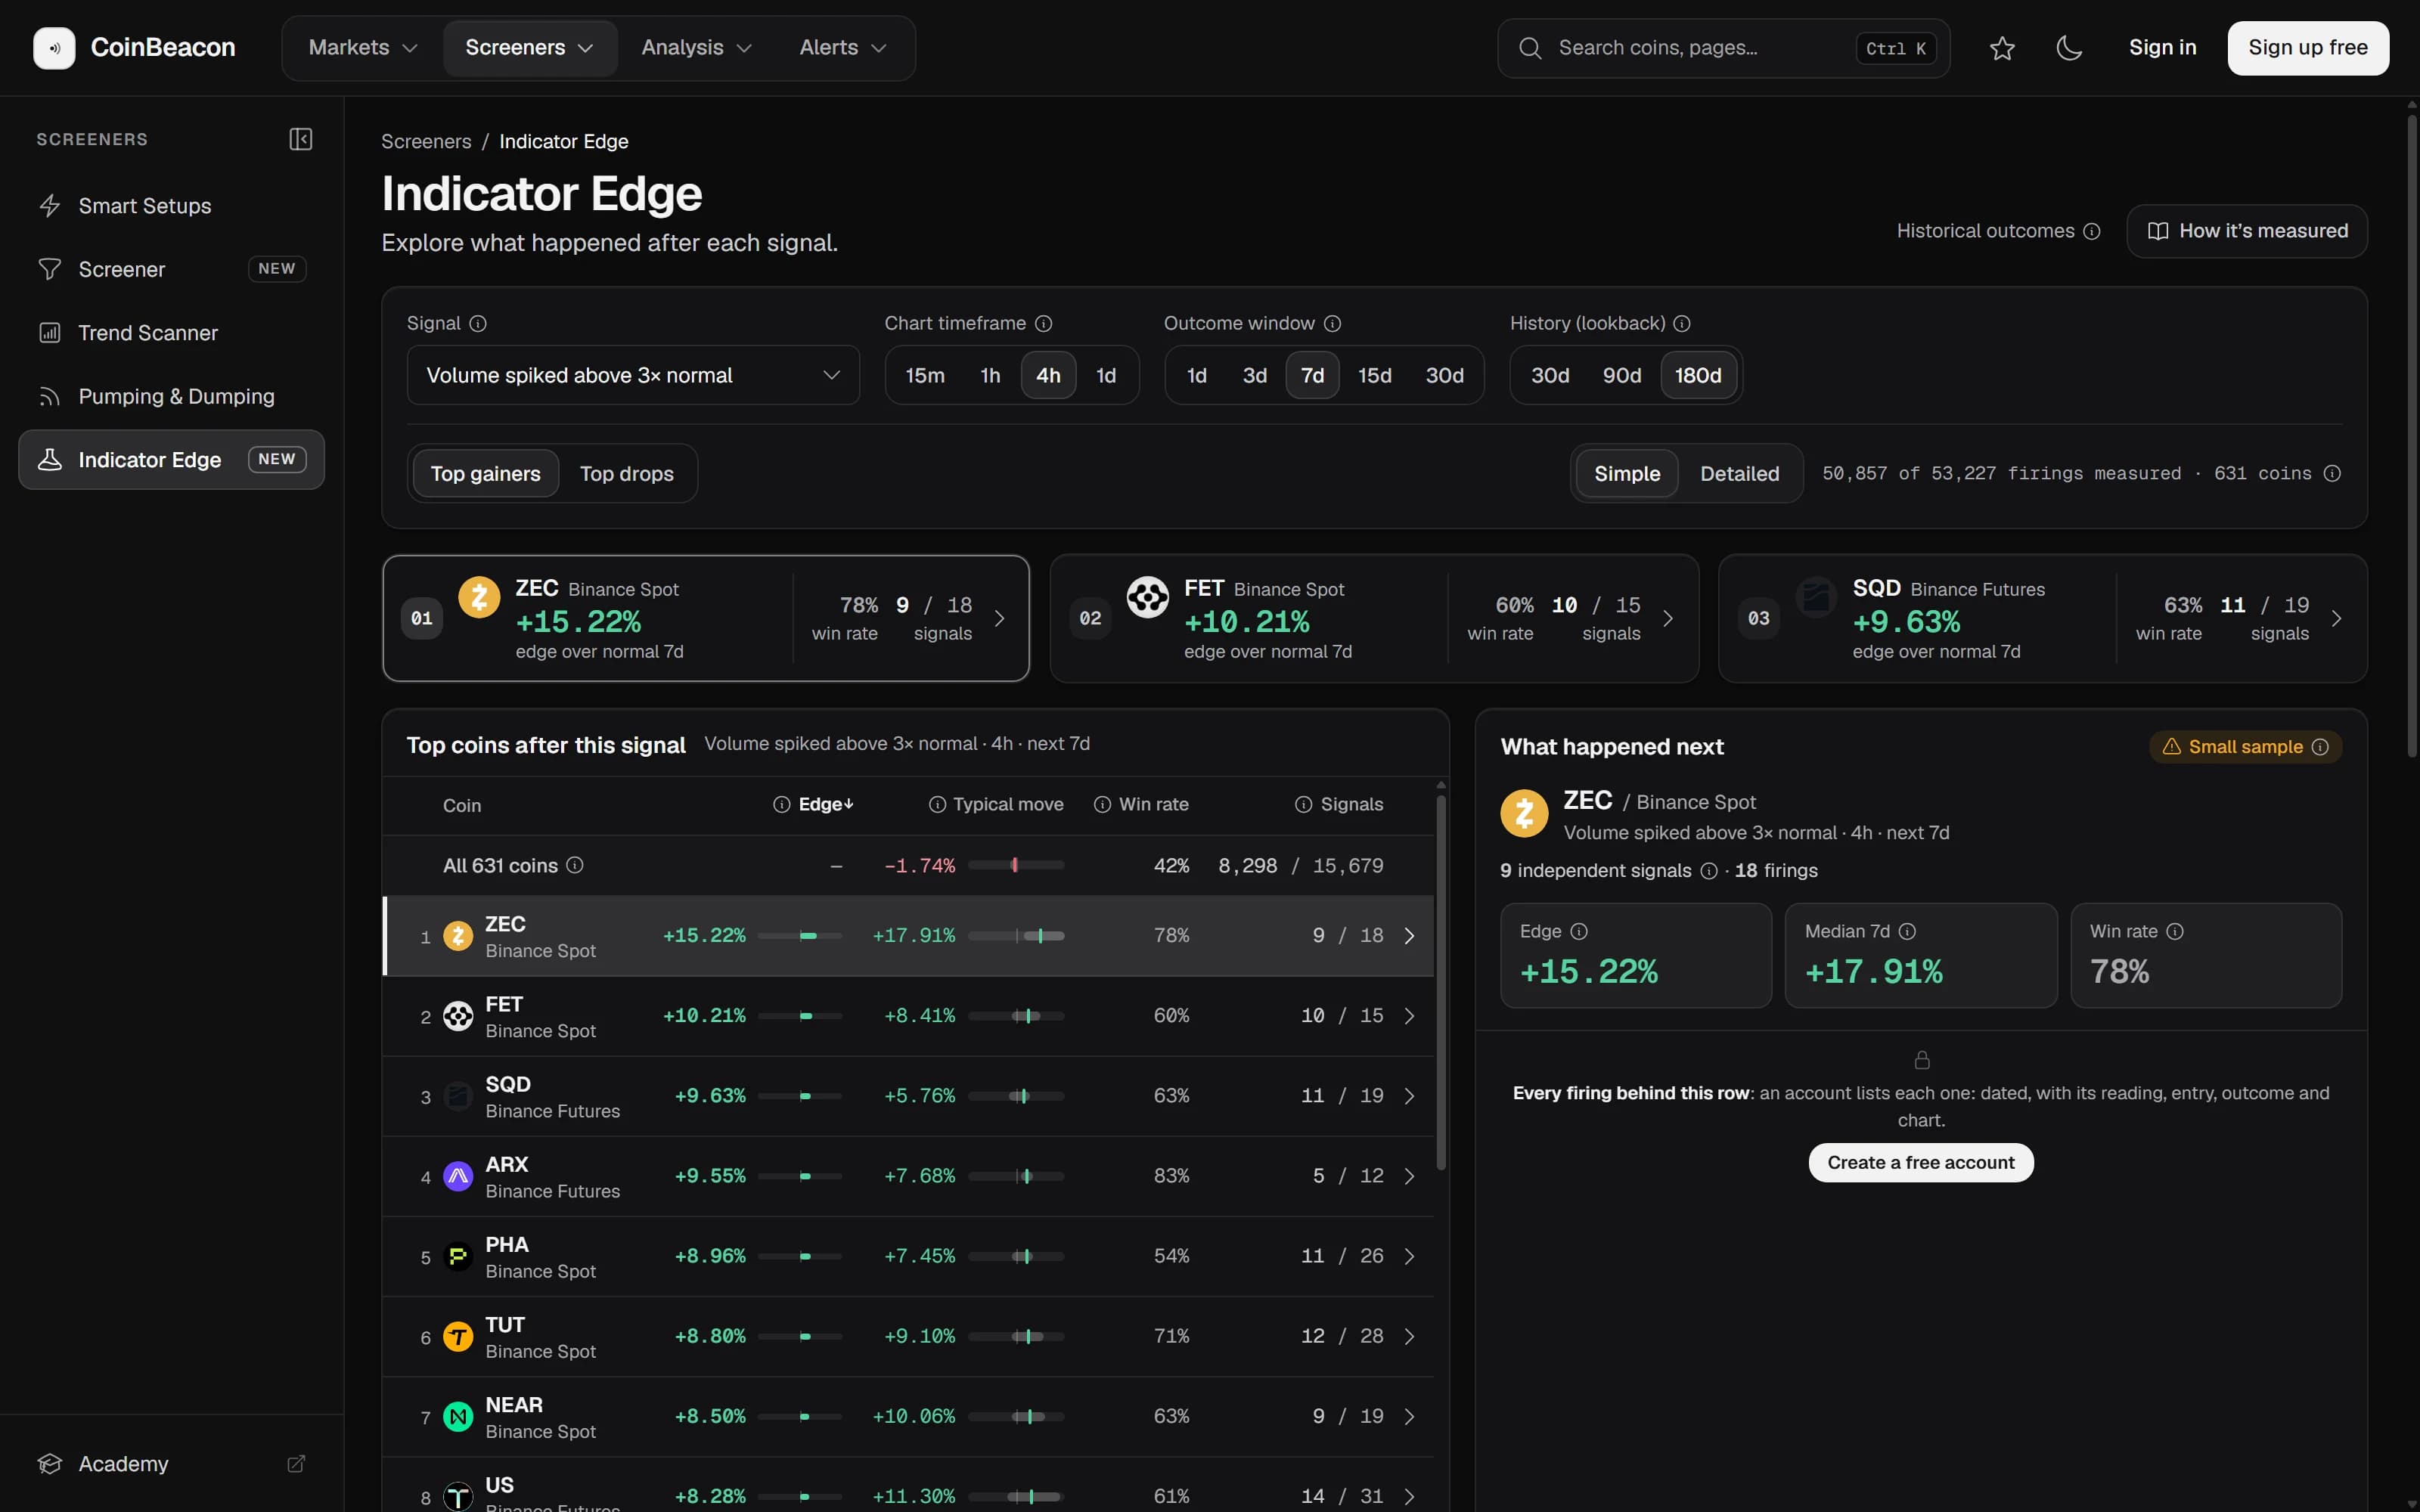
What crypto prices did after a candle traded three times its usual volume, on about 800 coins over six months, split by the way the candle closed.
Every tool these guides describe runs on the live market. Most open without an account; alerts need a free one.