Crypto volume spikes: what happened next
Jordan Ellis
Senior Product Marketing Manager, CoinBeacon
A sudden jump in trading volume shows that something changed in a market. It does not say which way the price goes next. This is what crypto prices actually did after a volume spike, across about 800 coins on five exchanges over six months, measured from CoinBeacon’s Indicator Edge.
What counts as a volume spike
Volume here is the value traded in a candle, in USDT. Indicator Edge compares each candle with the average of the candles before it: the previous 42 on the 4-hour chart, which is one week, the previous 24 on the hourly chart and the previous 30 on the daily chart. It records a signal when a candle’s volume crosses above three times that average, after the candle before it stayed at or below.
For every signal it records where the price closed a set time later, against the close of the spike candle. The first table uses the 4-hour chart and the close seven days later, for signals from 18 April to 8 October 2026 on Binance spot and the Binance, Bybit, OKX and Gate.io perpetual futures.
- A burst is one signal. Two spike candles in a row count once, and a repeat within five candles of the last one is not counted.
- Each exchange counts separately. A coin listed on three of the five exchanges can fire three times on the same candle. The tables count signals, with the number of different coins beside them.
- The median, not the average. Half the signals ended above the median and half below it, so one coin that doubled cannot drag it the way it would an average.
Every figure sits next to an ordinary week for the same coins: the move over seven days from any 4-hour candle, with a spike or without. In these months most weeks ended lower, so a fall after a spike means little until it is set against that.
A spike has no direction
Volume jumps on sharp falls as well as sharp rallies, so spikes taken together mix the two, and Indicator Edge does not record which way the spike candle moved. For this guide, each spike was matched with Indicator Edge’s Bollinger Band signals on the same candle, coin and exchange: a close that broke above the upper band, a close that broke below the lower band, or neither. That split is not a view Indicator Edge offers.
What followed a volume spike
| Signal | Signals (coins) | Median move | Ended higher |
|---|---|---|---|
| Every volume spike | 50,857 (802) | −1.58% | 42.5% |
| Closed above the upper Bollinger band | 9,834 (711) | −2.75% | 39.5% |
| Closed below the lower Bollinger band | 4,198 (648) | −1.42% | 42.5% |
| Every other spike | 36,825 (795) | −1.35% | 43.3% |
| An ordinary week | every candle | −1.04% | 45.1% |
Taken together, the week after a volume spike was weaker than an ordinary week: a median fall of 1.58% against 1.04%, with 42.5% of spikes ending higher against 45.1%.
The spikes that closed above the upper band, the ones a chart shows as a high-volume breakout, were followed by the weakest weeks: a median fall of 2.75%, with 39.5% ending higher. Spikes that closed below the lower band, and the rest, came closer to an ordinary week but stayed below it.
The shorter windows on the 4-hour chart point the same way. After one day the median spike was followed by −0.42%, with 44.7% higher, against −0.23% and 46.9% for an ordinary day. After three days it was −0.73% and 44.6%, against −0.62% and 45.4%.
How far prices moved
Besides the close a week later, Indicator Edge records the highest and lowest prices reached along the way. In the week after a 4-hour spike, the highest price was a median 8.13% above the spike candle’s close and the lowest a median 8.03% below it, against 7.88% and 7.39% in an ordinary week. After spikes that closed above the upper band the range was wider: 9.27% up and 9.36% down.
On the daily chart the difference was larger, 9.68% up and 9.80% down in the week after a spike, against 8.41% and 9.05%. On the hourly chart, over the following day, there was little difference: 2.71% up and 2.62% down, against 2.83% and 2.45%.
On the daily and hourly charts
| Signal | Signals (coins) | Median move | Ended higher |
|---|---|---|---|
| Every volume spike | 8,504 (628) | −2.80% | 39.3% |
| Closed above the upper Bollinger band | 2,114 (472) | −4.28% | 36.8% |
| Closed below the lower Bollinger band | 243 (105) | −3.85% | 34.6% |
| Every other spike | 6,147 (606) | −2.38% | 40.3% |
| An ordinary week | every candle | −2.00% | 42.3% |
On the daily chart every group was followed by a weaker week than the ordinary one, which here is measured over a longer stretch of history and is a looser yardstick. The spikes that closed above the upper band were followed by the weakest weeks: a median fall of 4.28%, with 36.8% higher. Only 243 daily spikes on 105 coins closed below the lower band, a sample small enough for one market-wide move to decide.
The hourly signals start on 23 June 2026 and are measured over the following day. Taken together, spikes were followed by a slightly weaker day than usual: −0.15%, with 47.1% higher, against +0.03% and 50.2% for an ordinary day. One group was followed by a better day than usual: spikes that closed below the lower band, at +0.63% with 56.9% higher. Spikes that closed above the upper band were followed by −0.79%, with 41.0% higher.
How to read these numbers
- They describe one stretch of market. April to October 2026, for coins whose ordinary week ended lower more often than higher. In a rising market every row would move, the ordinary week included.
- Signals arrive in crowds. A market-wide move lifts volume on hundreds of coins at once. On the 4-hour candle that closed at 16:00 UTC on 8 October, 319 coins spiked together, for 739 signals across the five exchanges, and the week after it is one market event counted hundreds of times.
- Only coins still listed are measured. Indicator Edge reads the pairs each exchange lists today, so coins delisted during these months are missing, which flatters the figures.
- A median hides the spread. Half the signals did better than the median and half did worse, often by a wide margin. Indicator Edge shows each coin’s range.
- The past is not a forecast. These are measurements of what followed, not a rule that it will happen again, and none of it is advice to buy or sell.
Find spikes in the app
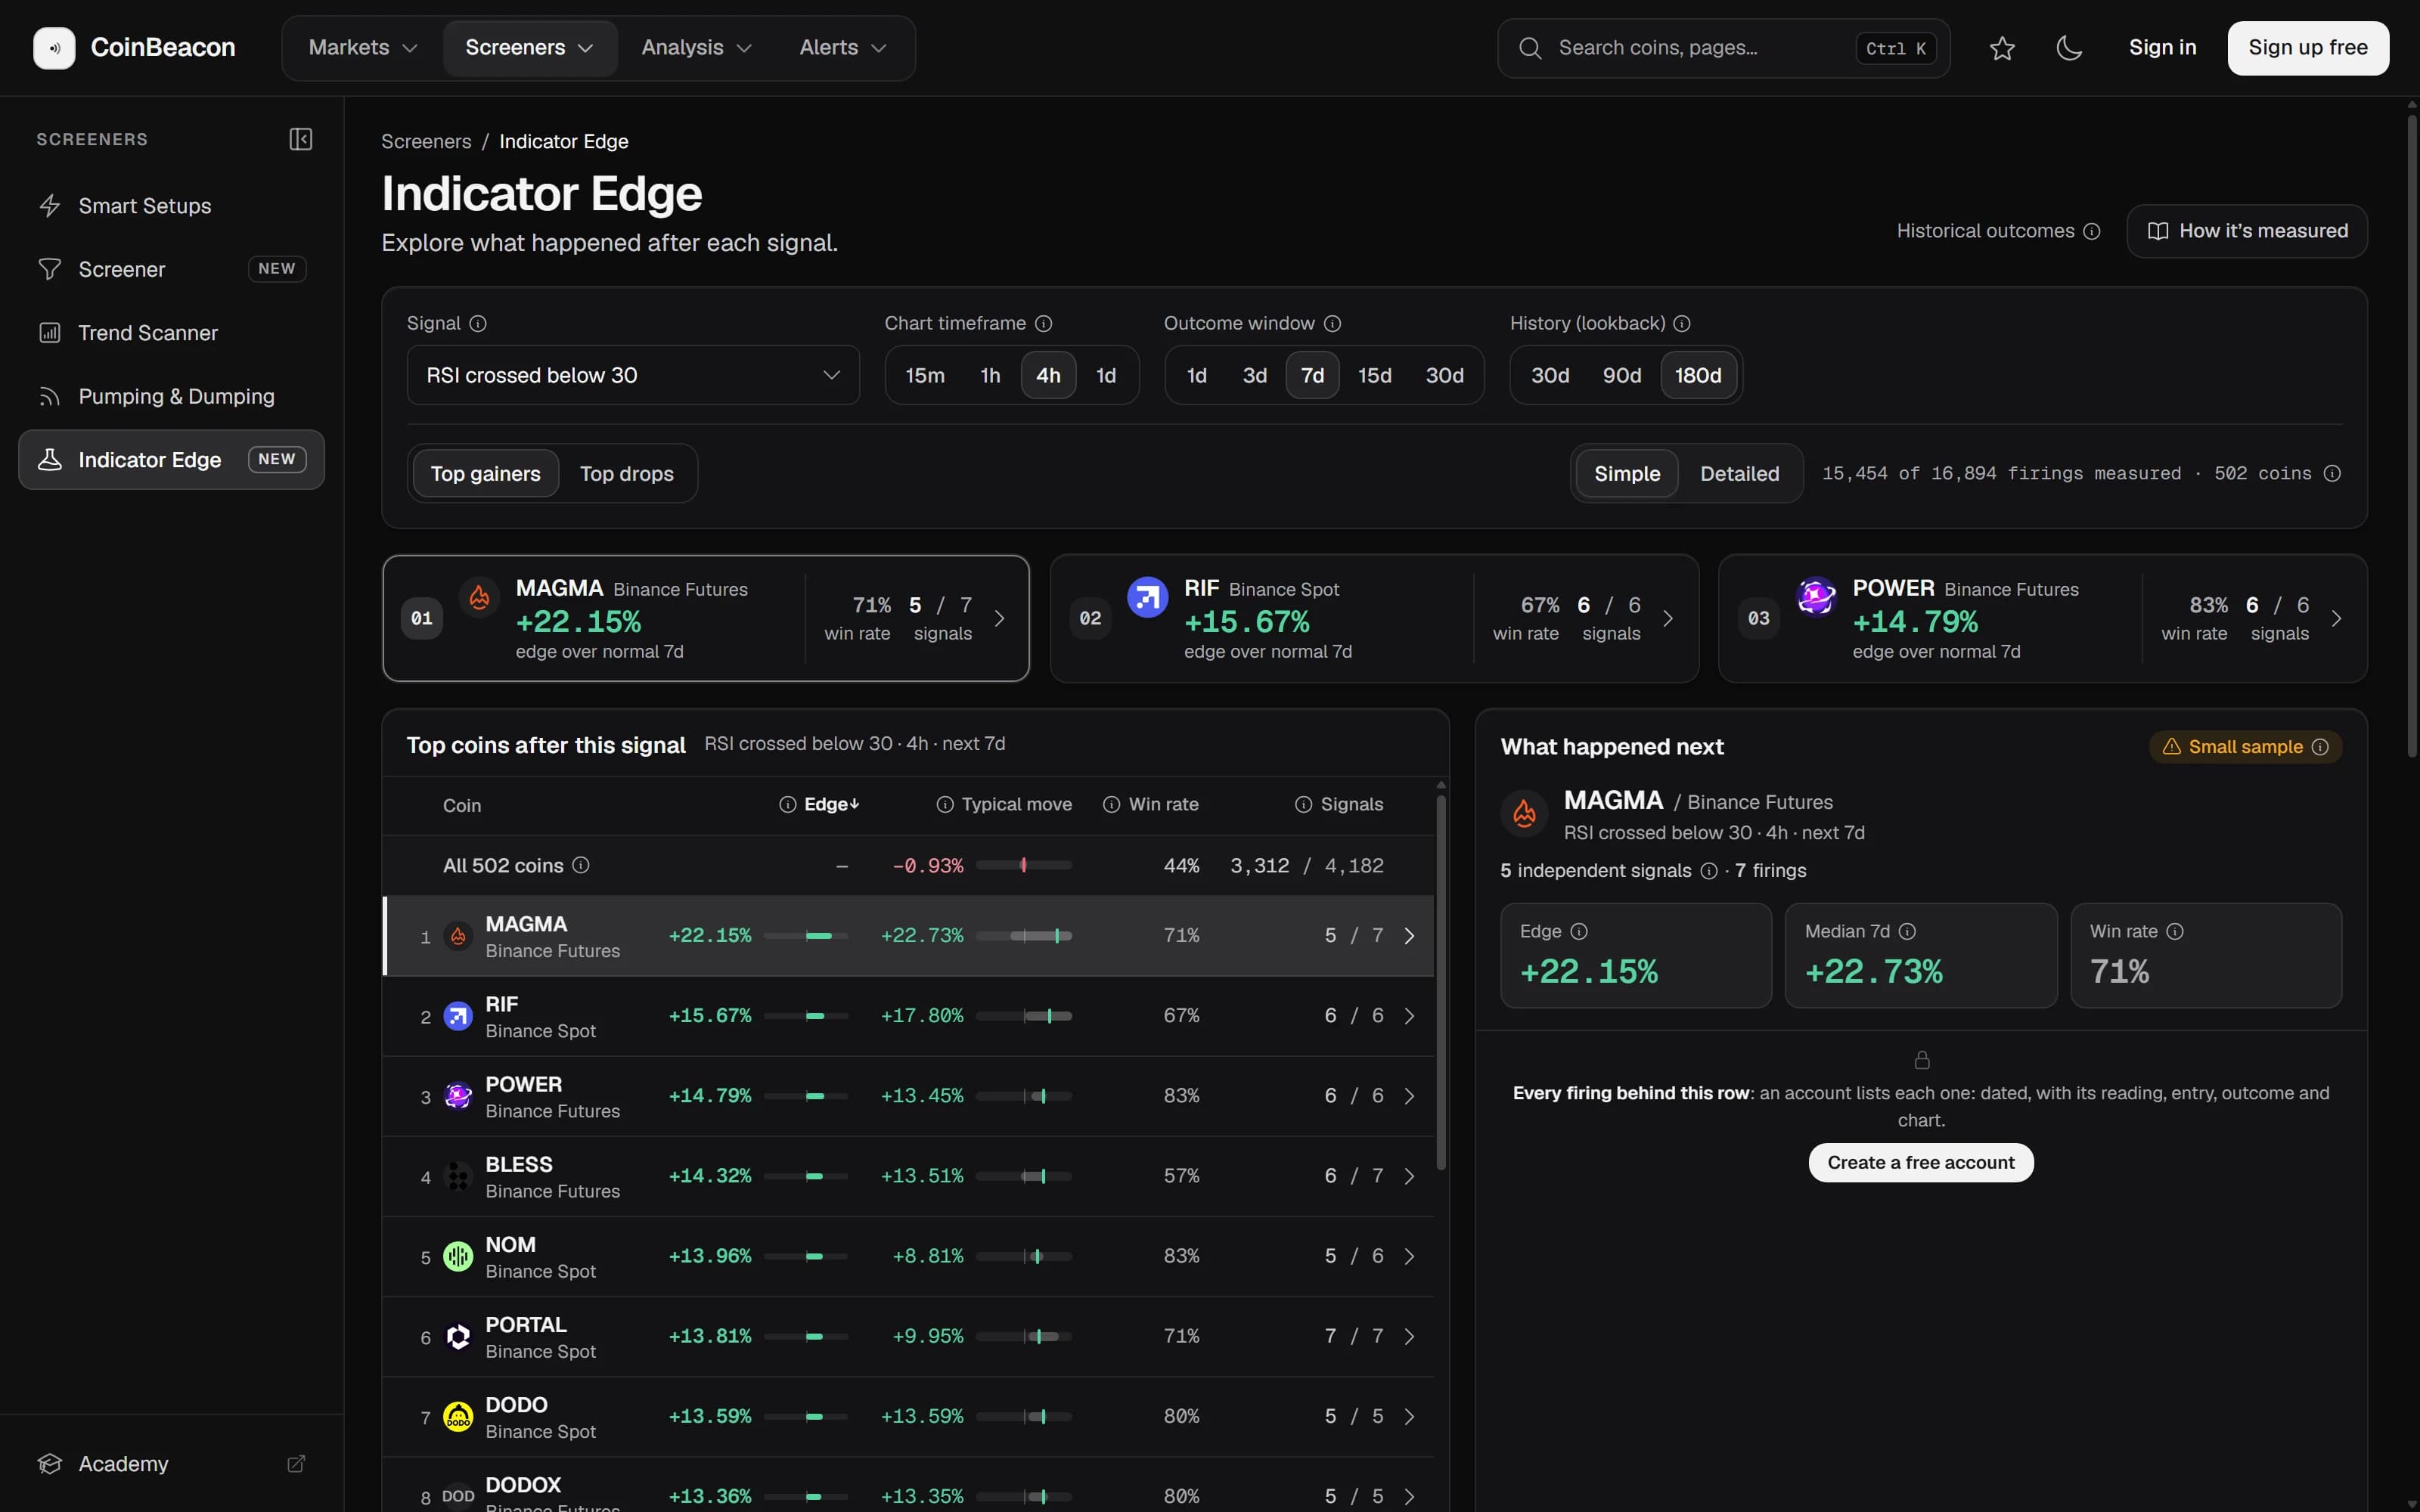
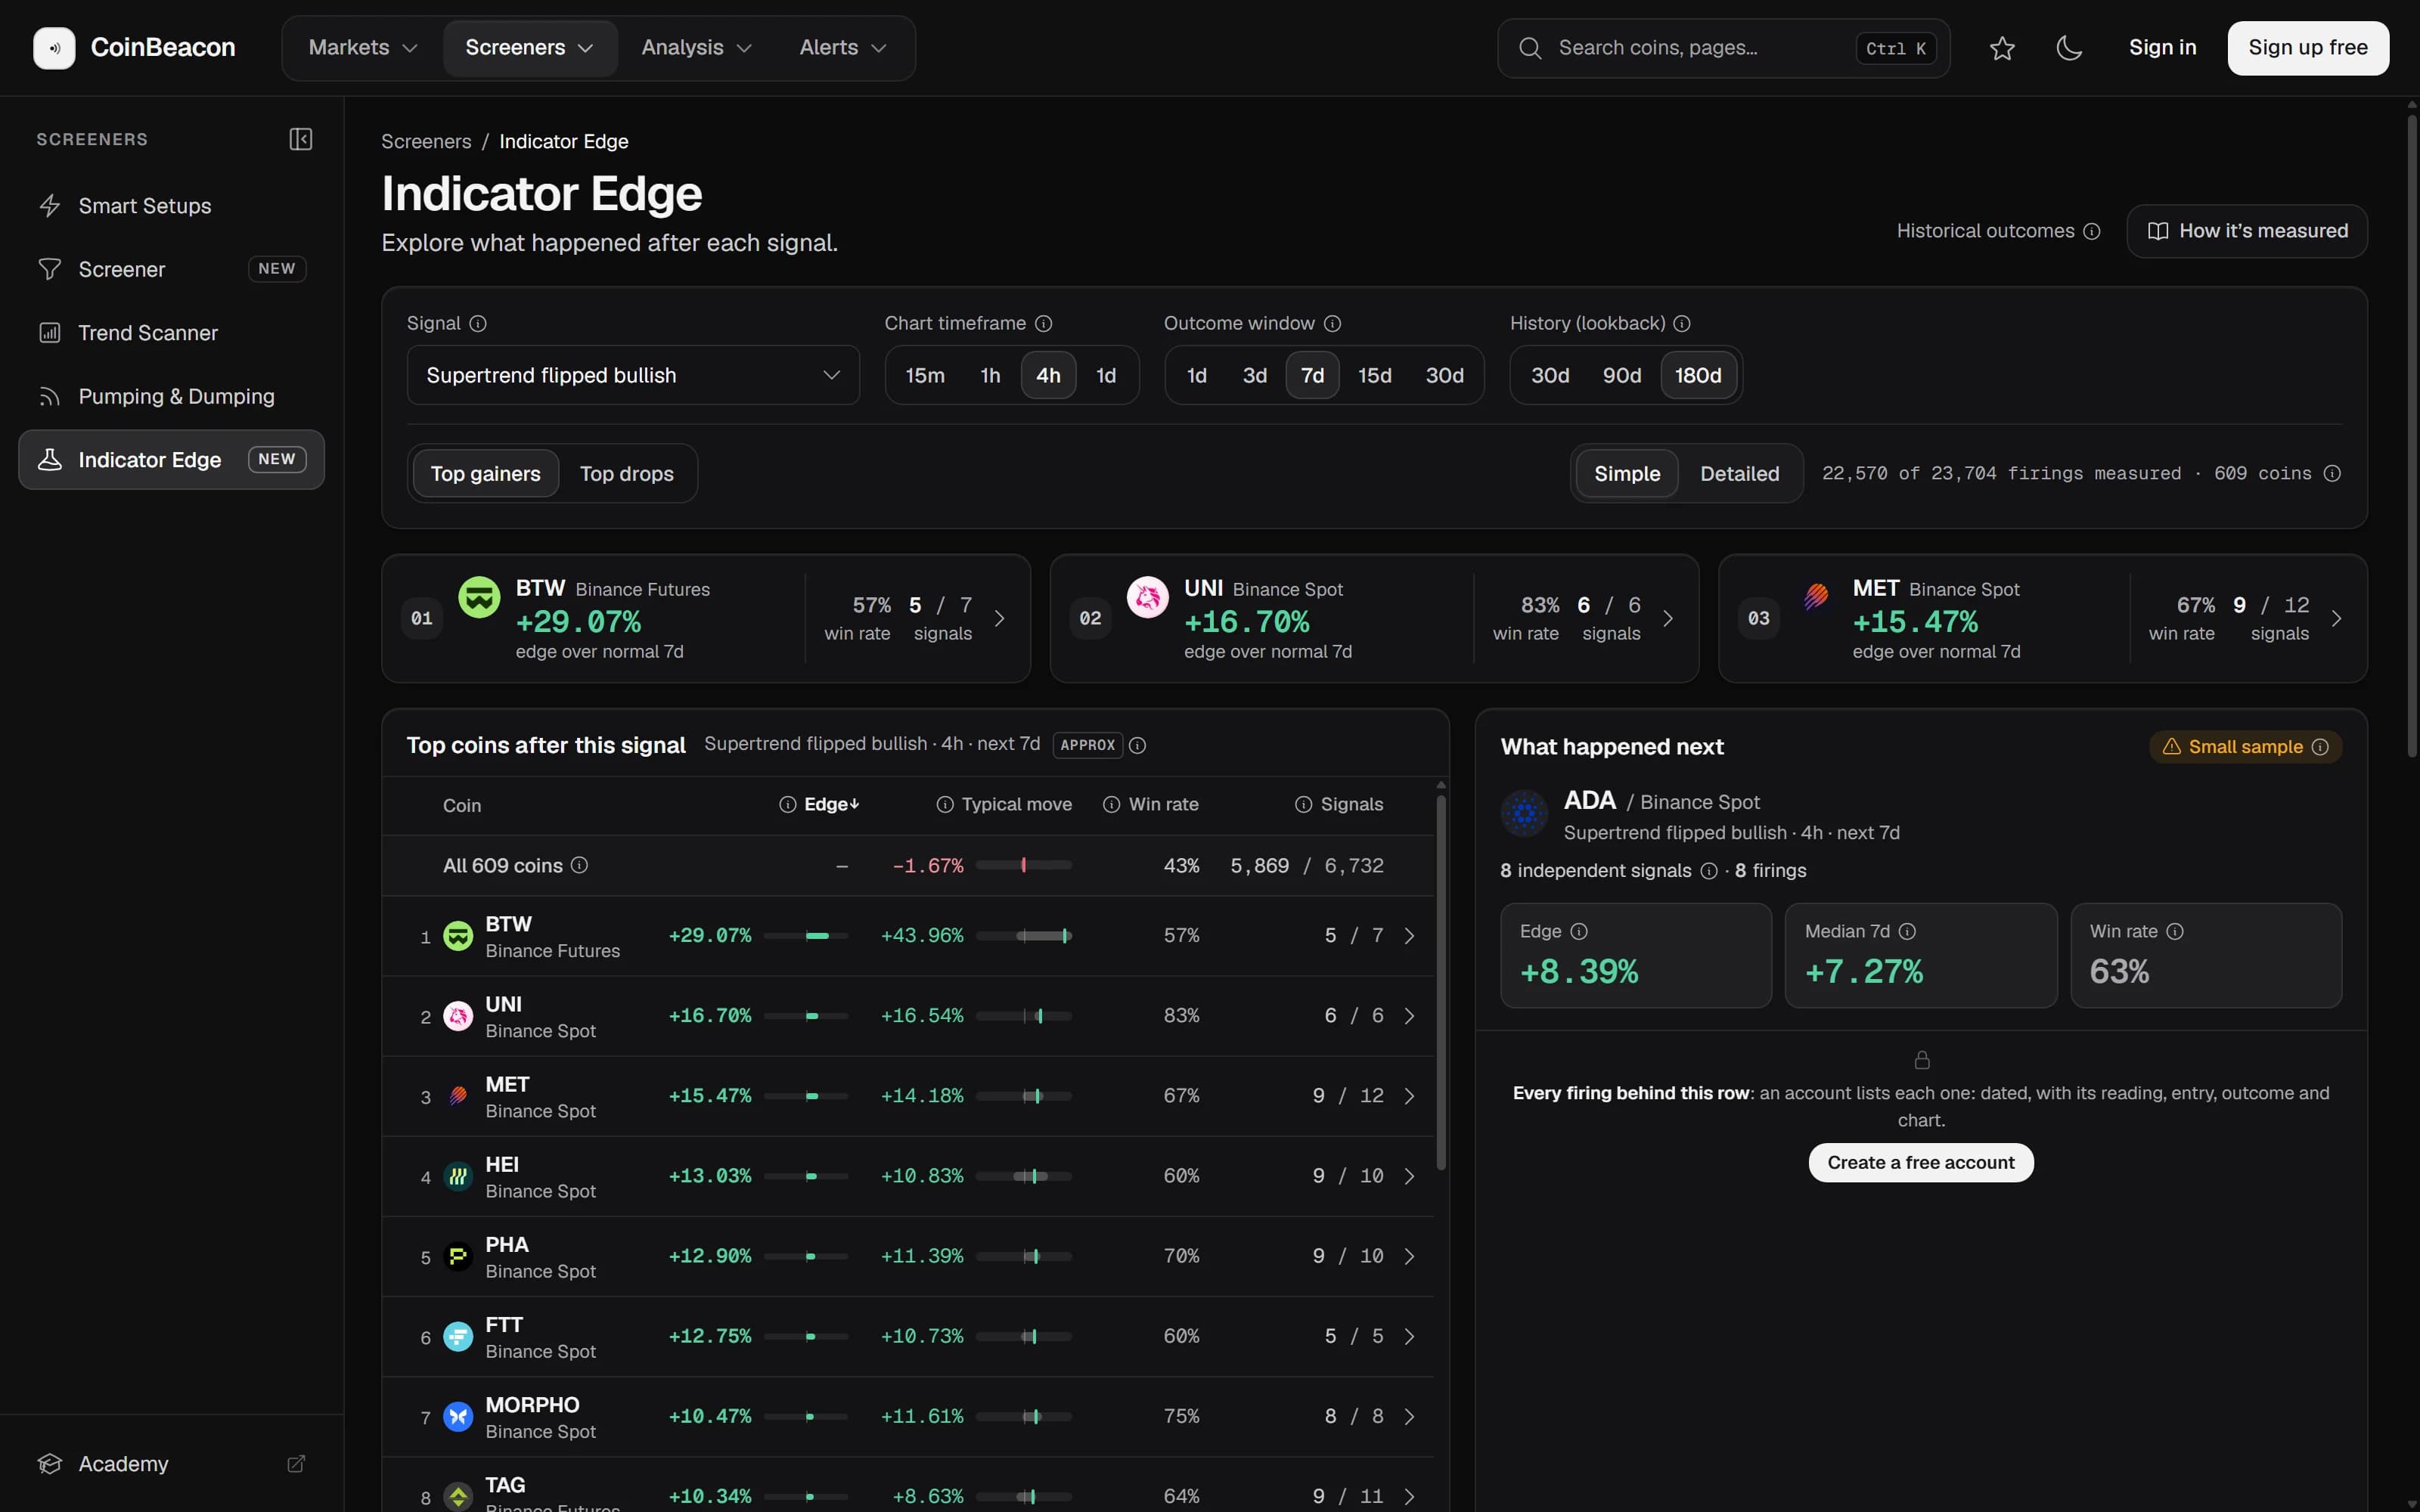
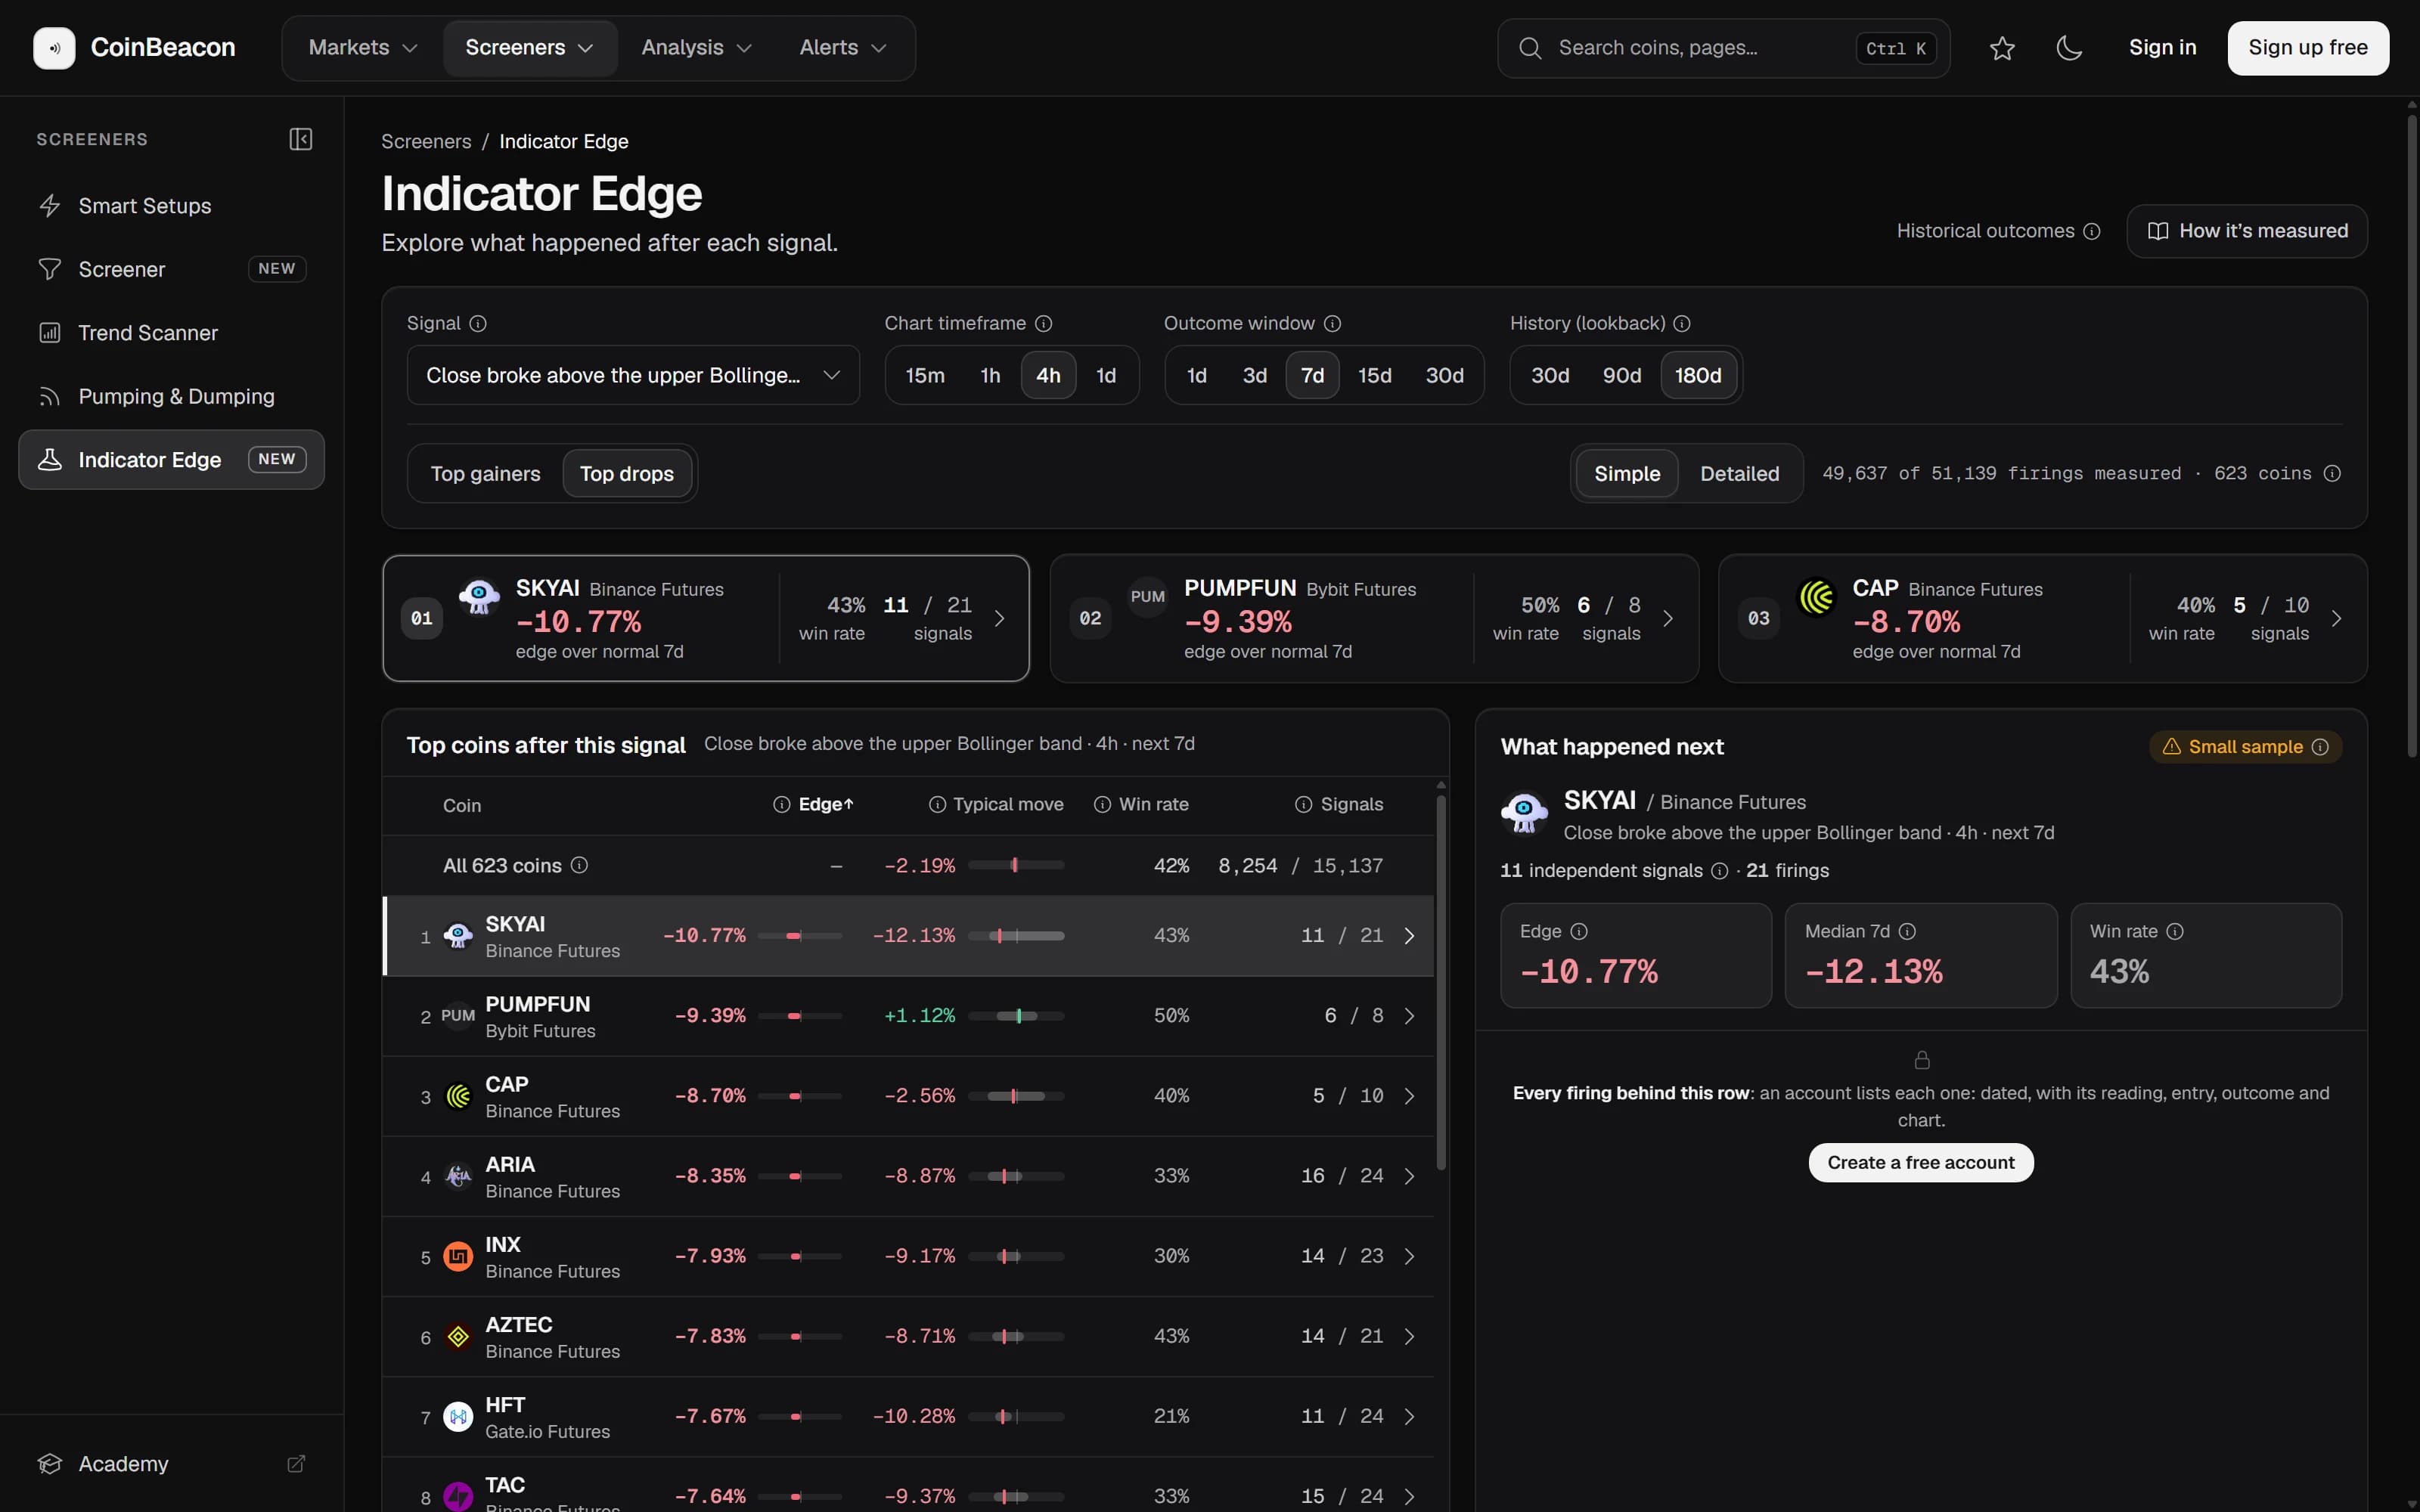
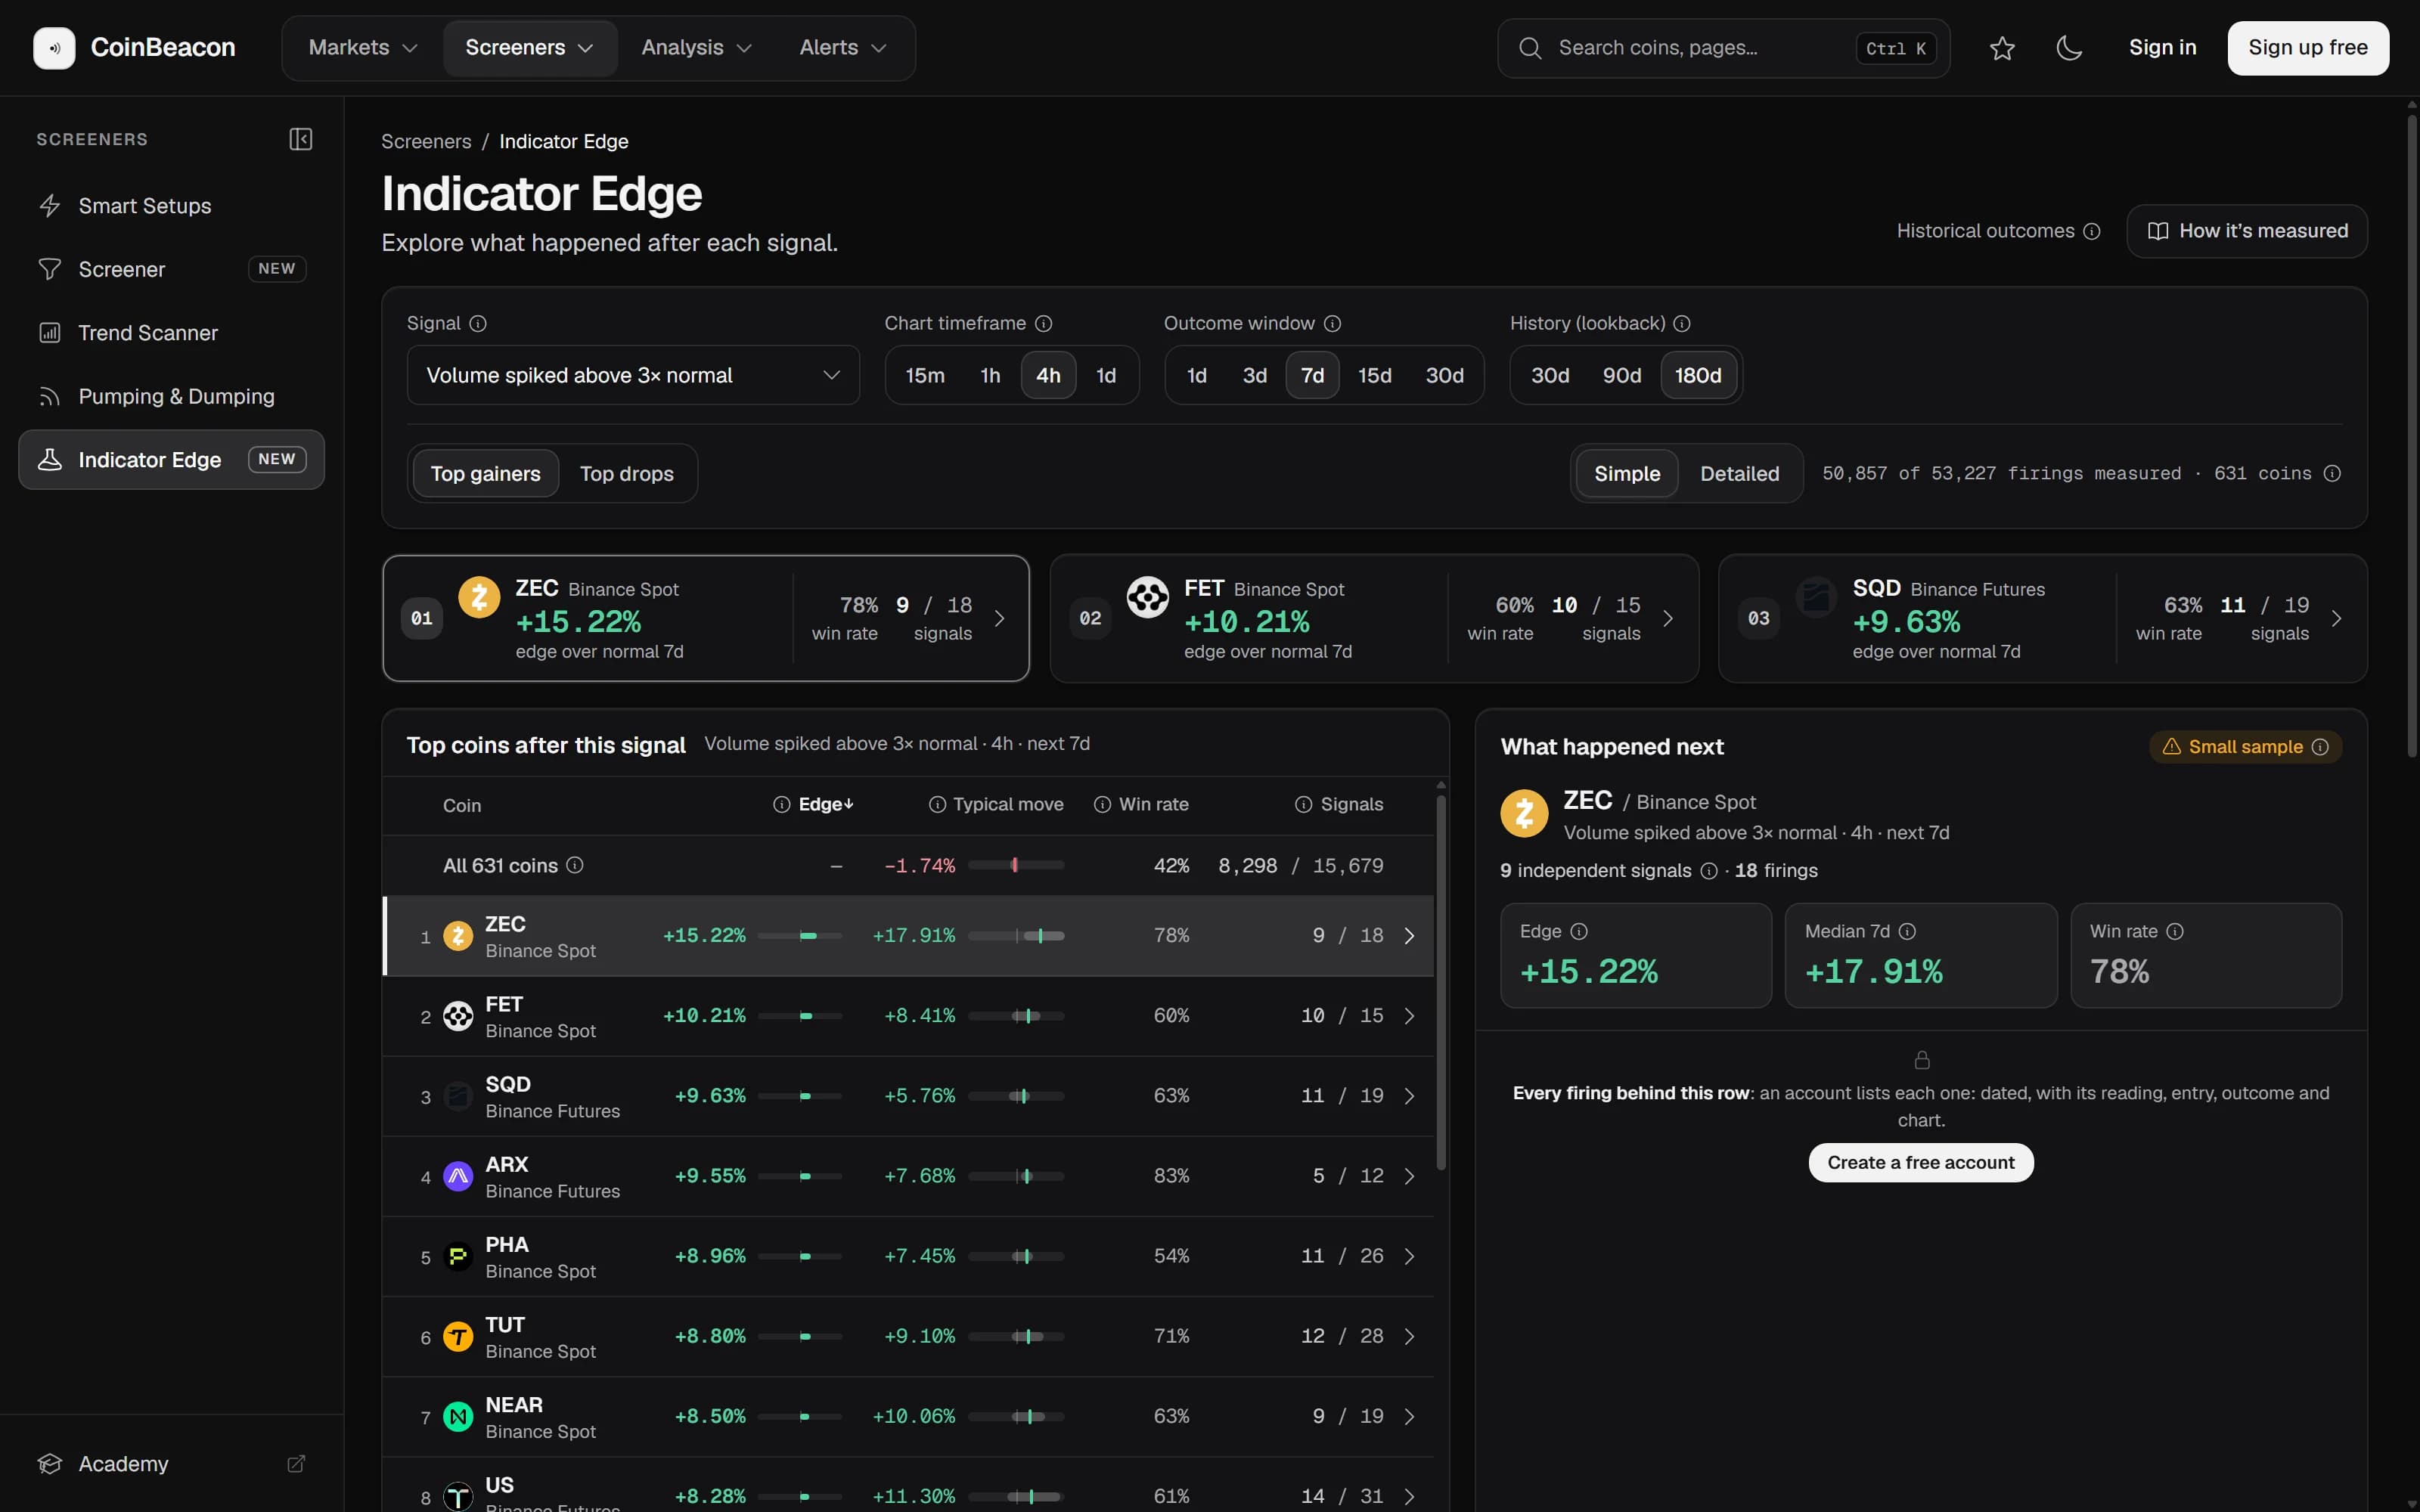
In Indicator Edge, under Screeners, choose Volume spiked above 3× normal in the Signal menu to rank coins by what followed their own spikes. Chart timeframe 4h, Outcome window 7d and History 180d match the first table; the RSI guide explains the board.
To see spikes as they happen, Volume movers ranks markets by how many times their normal volume they are trading right now, over windows from 1 minute to 1 hour. The trending coins guide explains how it measures normal.
Get an alert when volume spikes
A volume alert watches one coin and messages you when a closed candle trades a multiple of its recent average.
- Pick the coin and the chart. Search the coin, choose the exchange, and pick a timeframe from 1 minute to 4 hours.
- Choose the spike size. 2×, 3×, 5× or 10× the average of the previous 20 candles, or any multiple from 2× up.
- Pick where it reaches you. Email, Telegram, Discord or a webhook. The channels guide shows how to connect each one.
The alert’s rule is close to Indicator Edge’s but not the same. It always compares with the previous 20 candles, whatever the chart, and it fires whenever a closed candle reaches your multiple, then waits out the cooldown you set before it can fire again. Markets averaging under 1,000 USDT a candle are skipped, so a handful of trades on a quiet market cannot read as a spike. Like Indicator Edge, it does not look at which way the candle moved. To watch every coin on an exchange instead of one, use Scan all coins with Volume.
For the band side of the split, see what happened after Bollinger Band breakouts.