How to use Indicator History: what price did after an indicator event
Jordan Ellis
Senior Product Marketing Manager, CoinBeacon
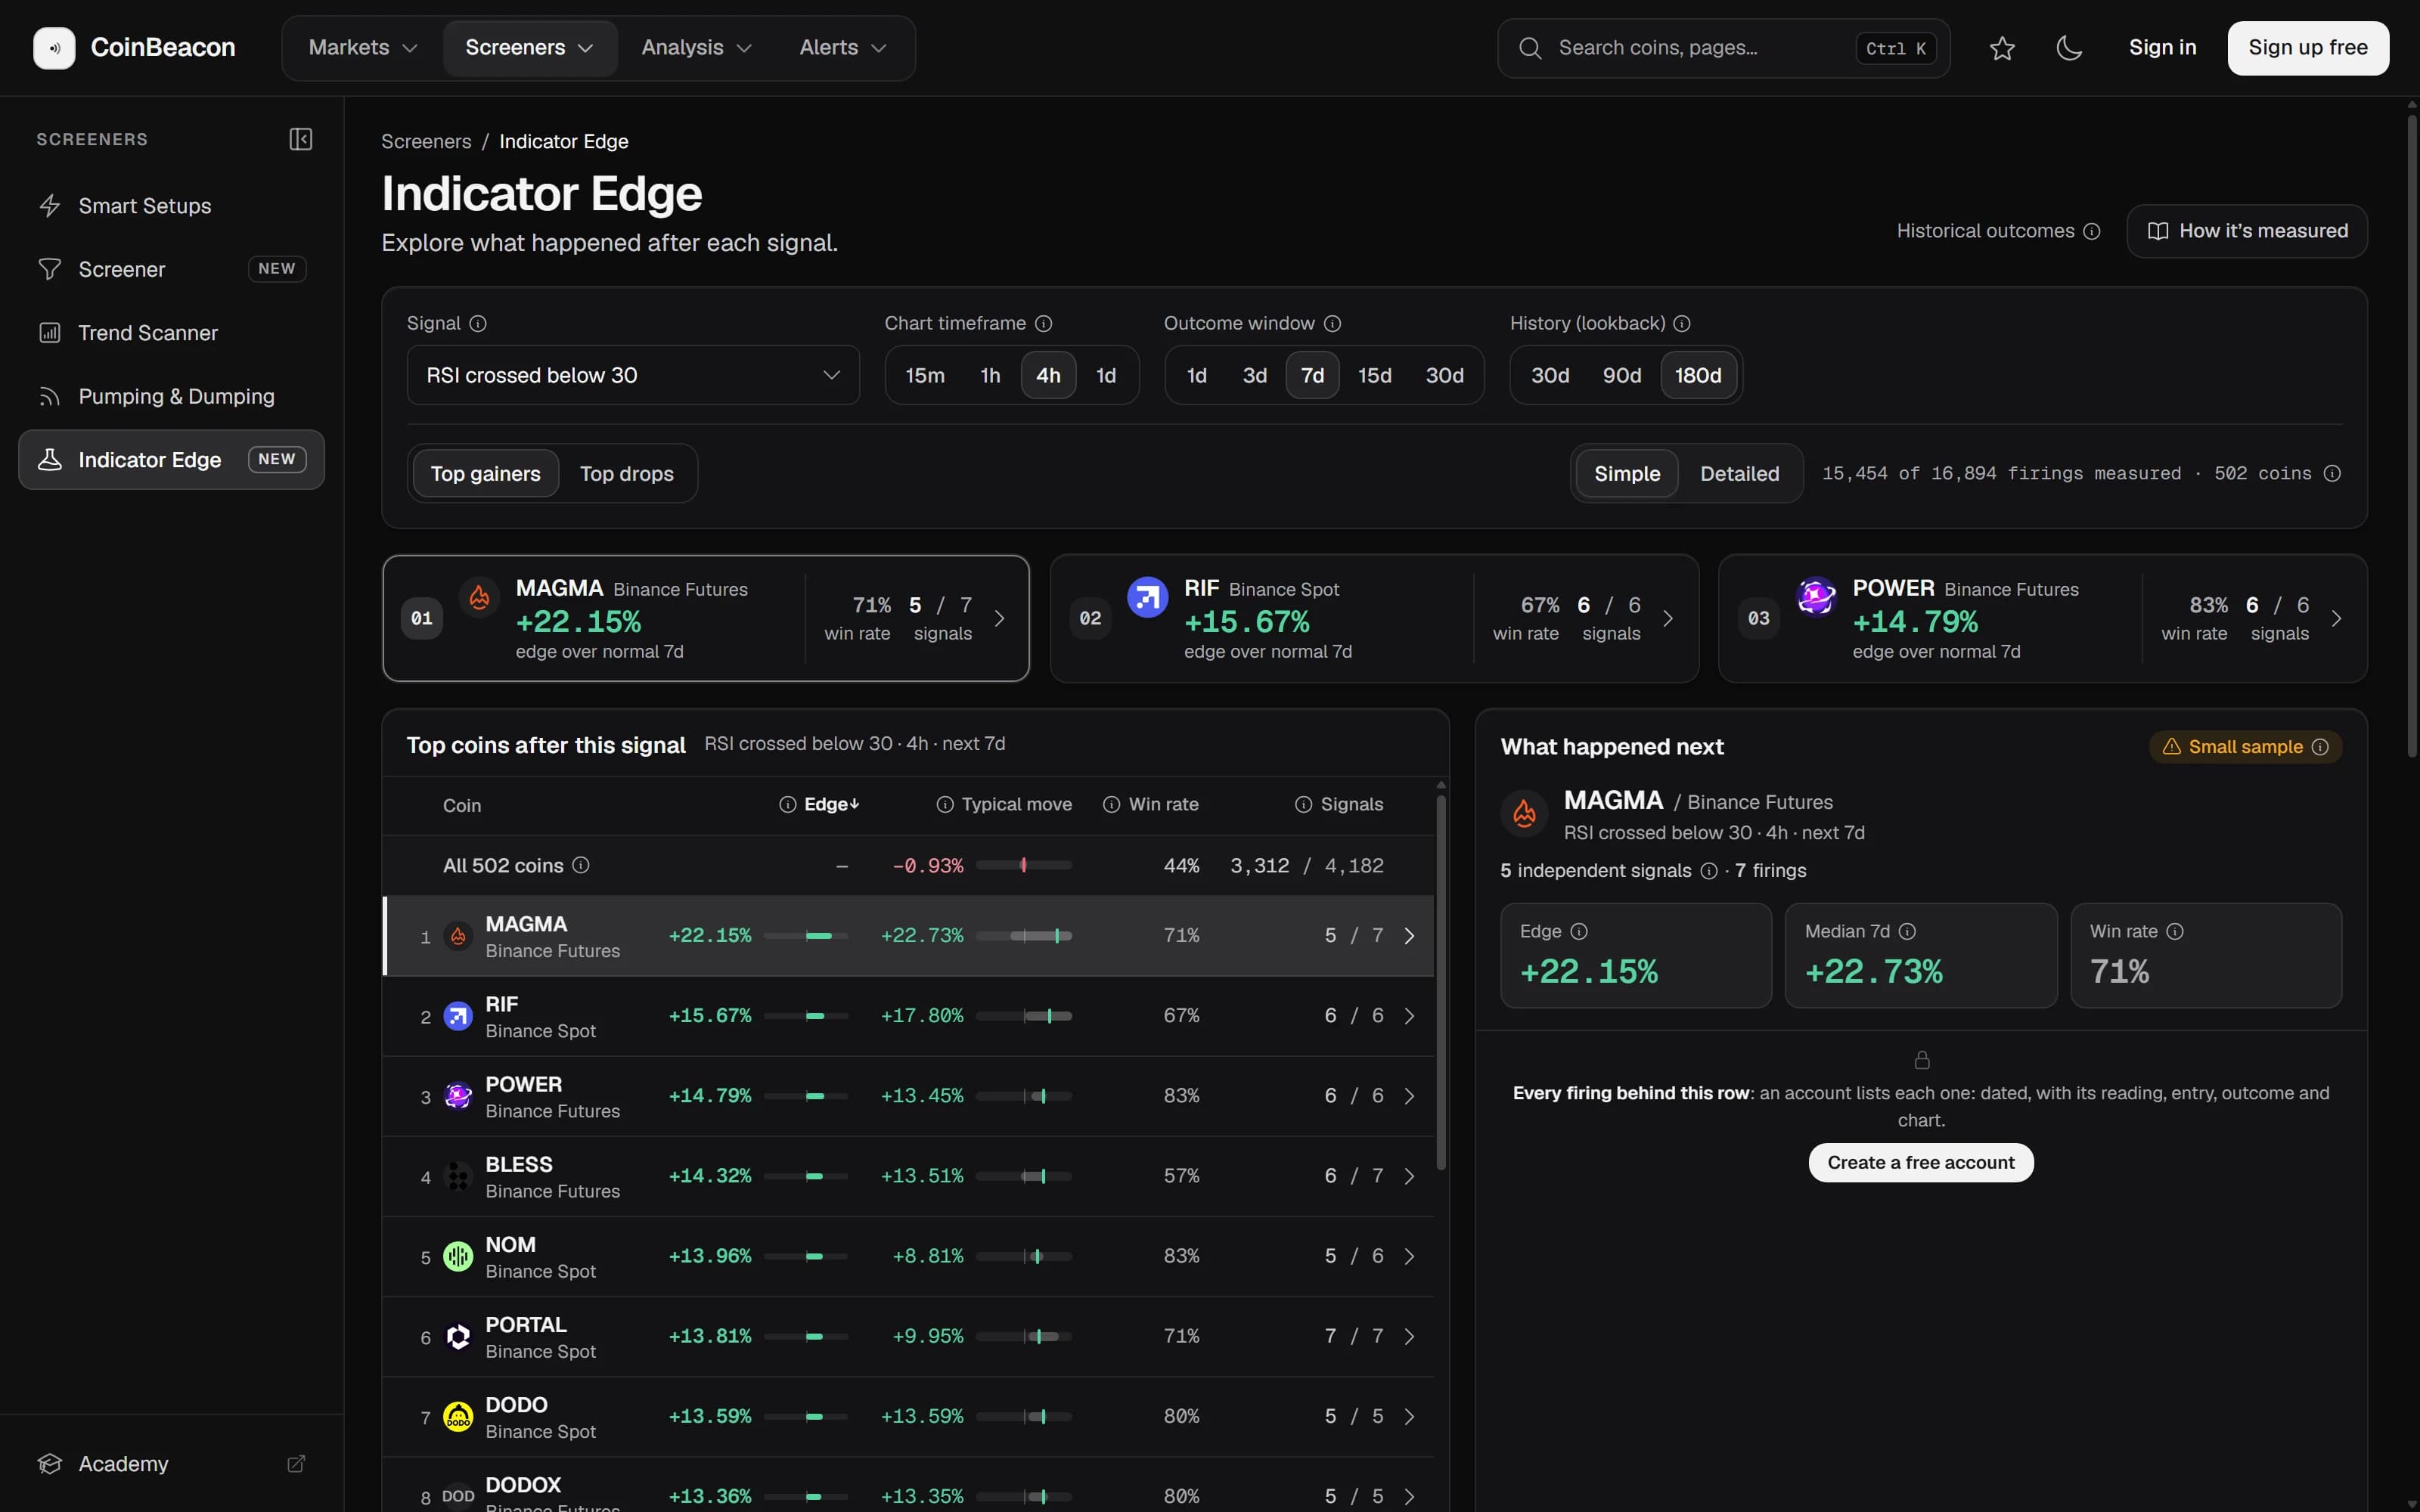
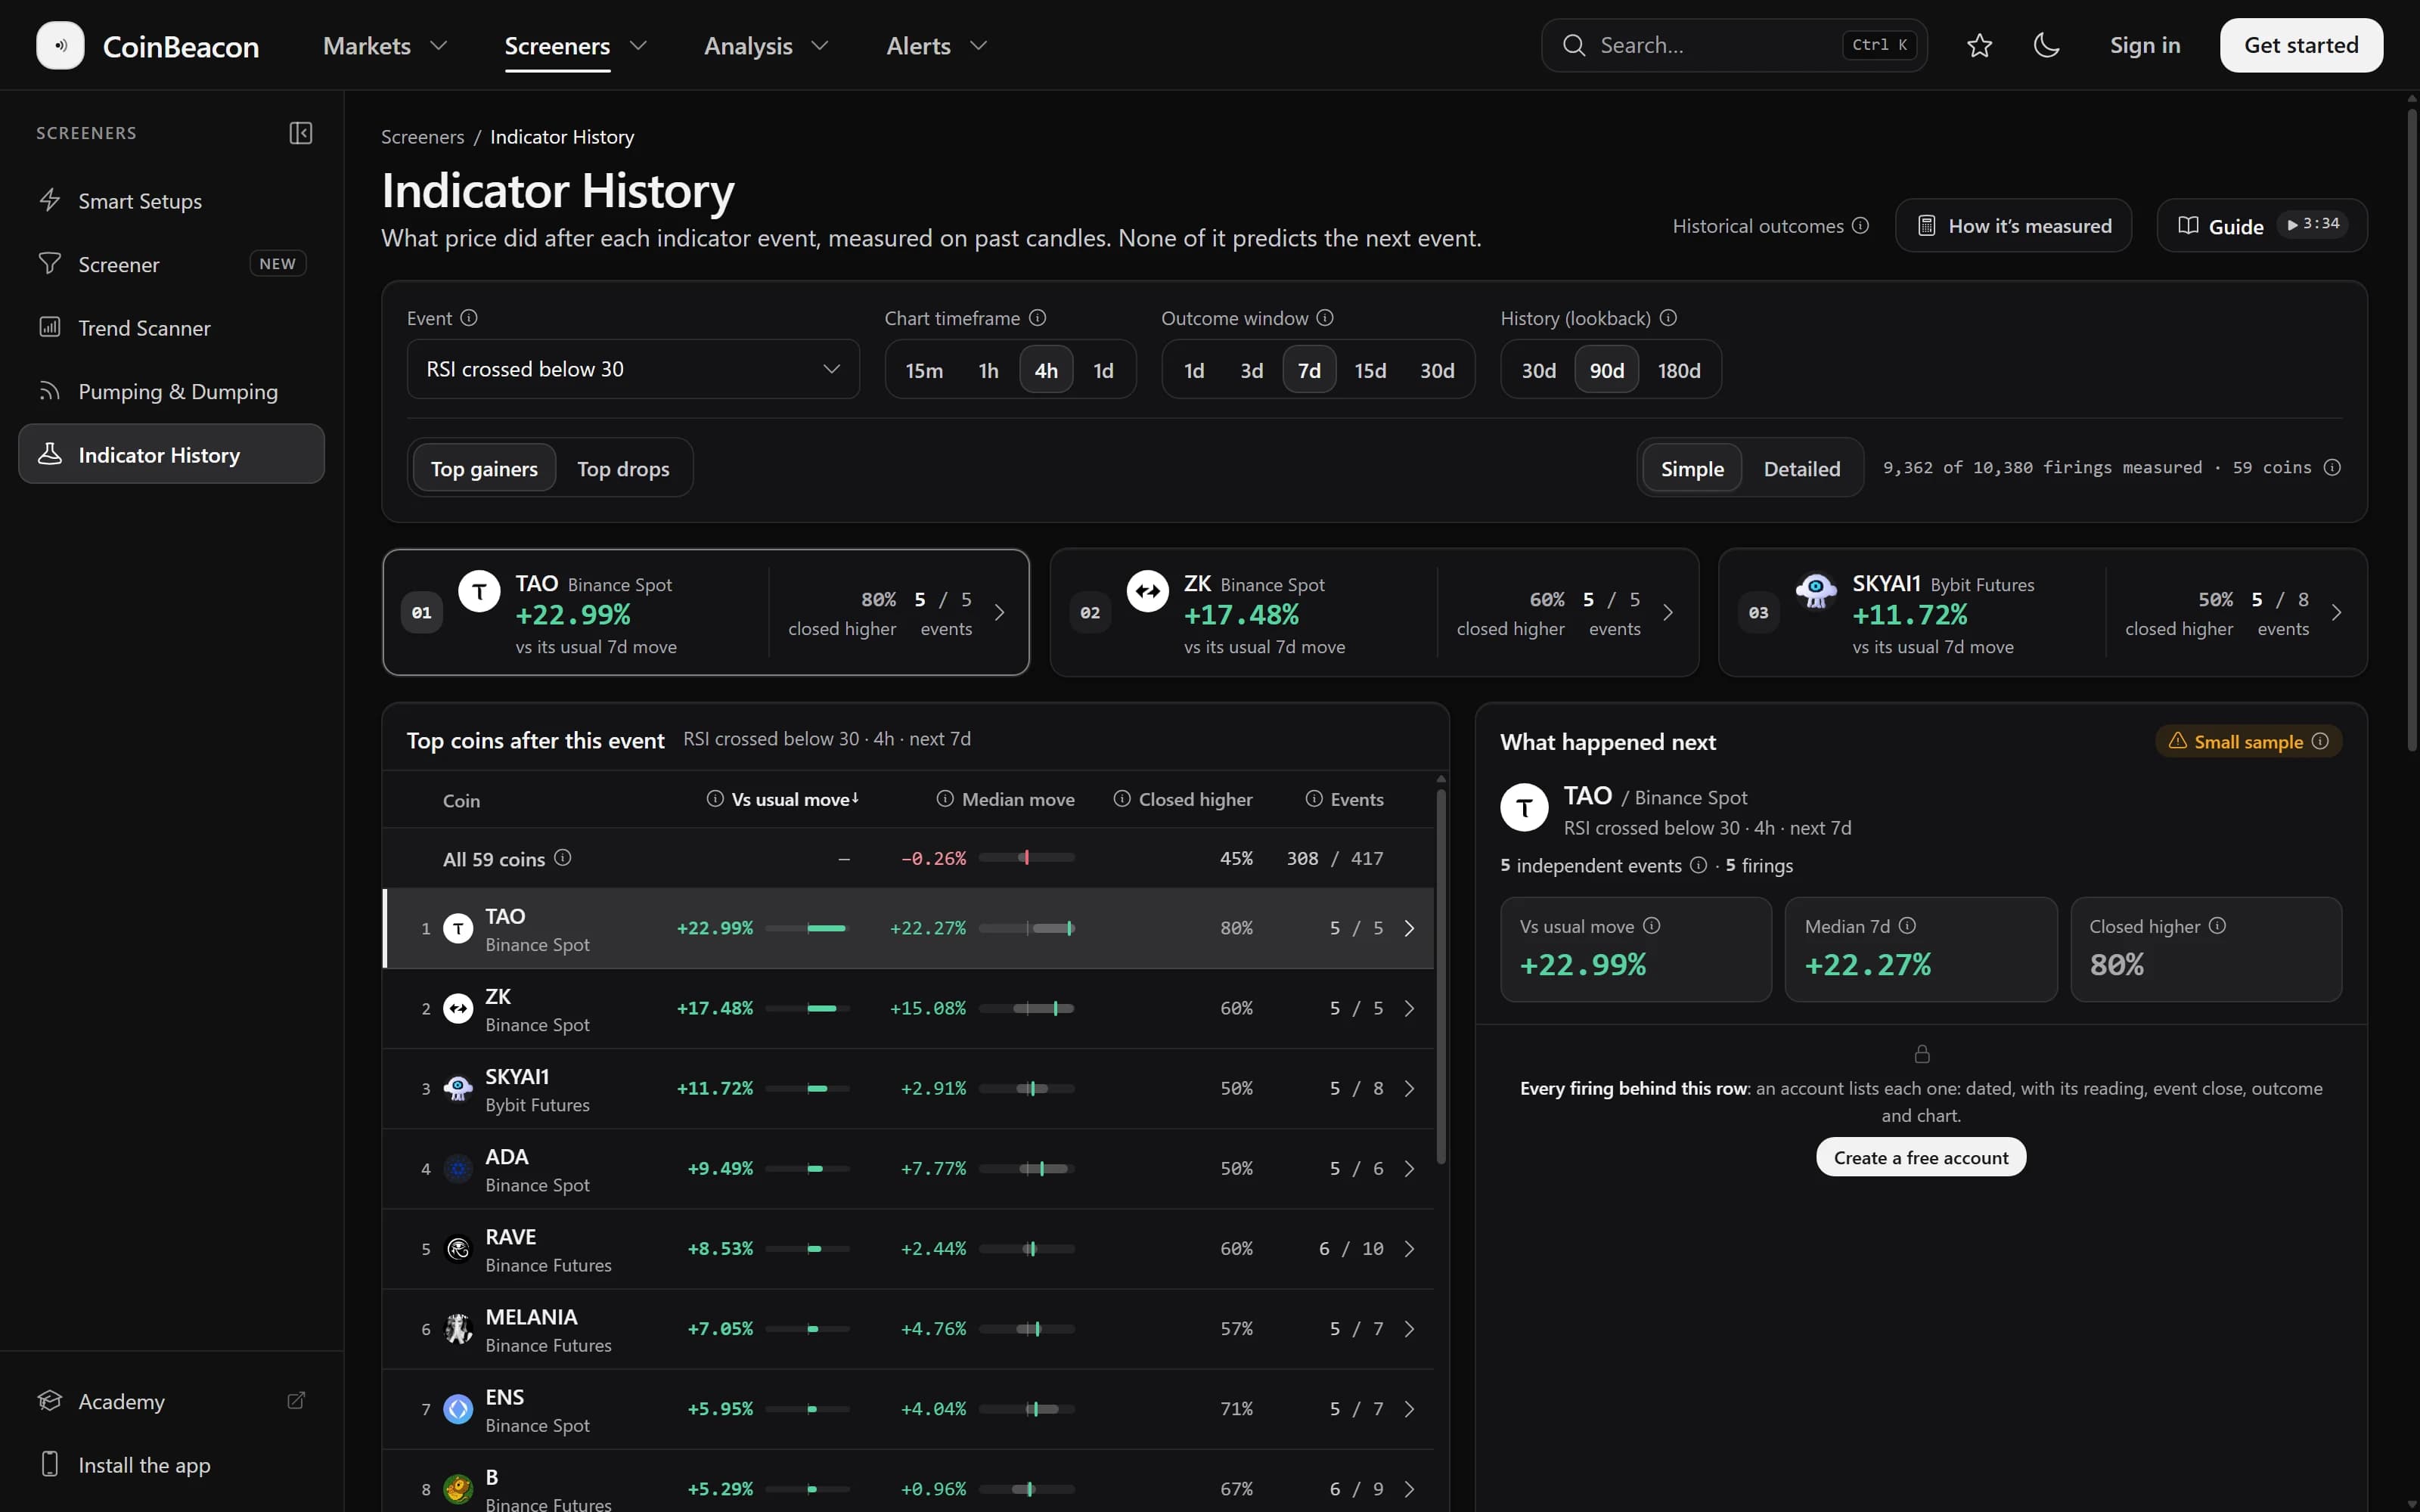
Indicator History takes an indicator event, such as RSI crossing below 30, and shows what each coin’s price did after it in past data, measured against that coin’s usual move. The film above walks through the page, and this guide covers the same ground in writing.
What Indicator History shows
In the app, Indicator History is under Screeners. You choose an event and a timeframe, and the page ranks every coin with enough past firings by how its price moved afterwards. Events are read on closed candles, every firing is stored when it happens, and a settled outcome is never measured again.
Pick an event
The Event menu holds 19 threshold crosses, grouped by indicator:
- RSI. Crossing below 30, 25, 20 or 15, and above 70, 75, 80 or 85.
- MACD. The MACD line crossing above or below its signal line.
- Moving averages. The 50-period SMA crossing above or below the 200-period SMA: golden and death crosses.
- EMA 200. Price crossing above or below the 200-period EMA.
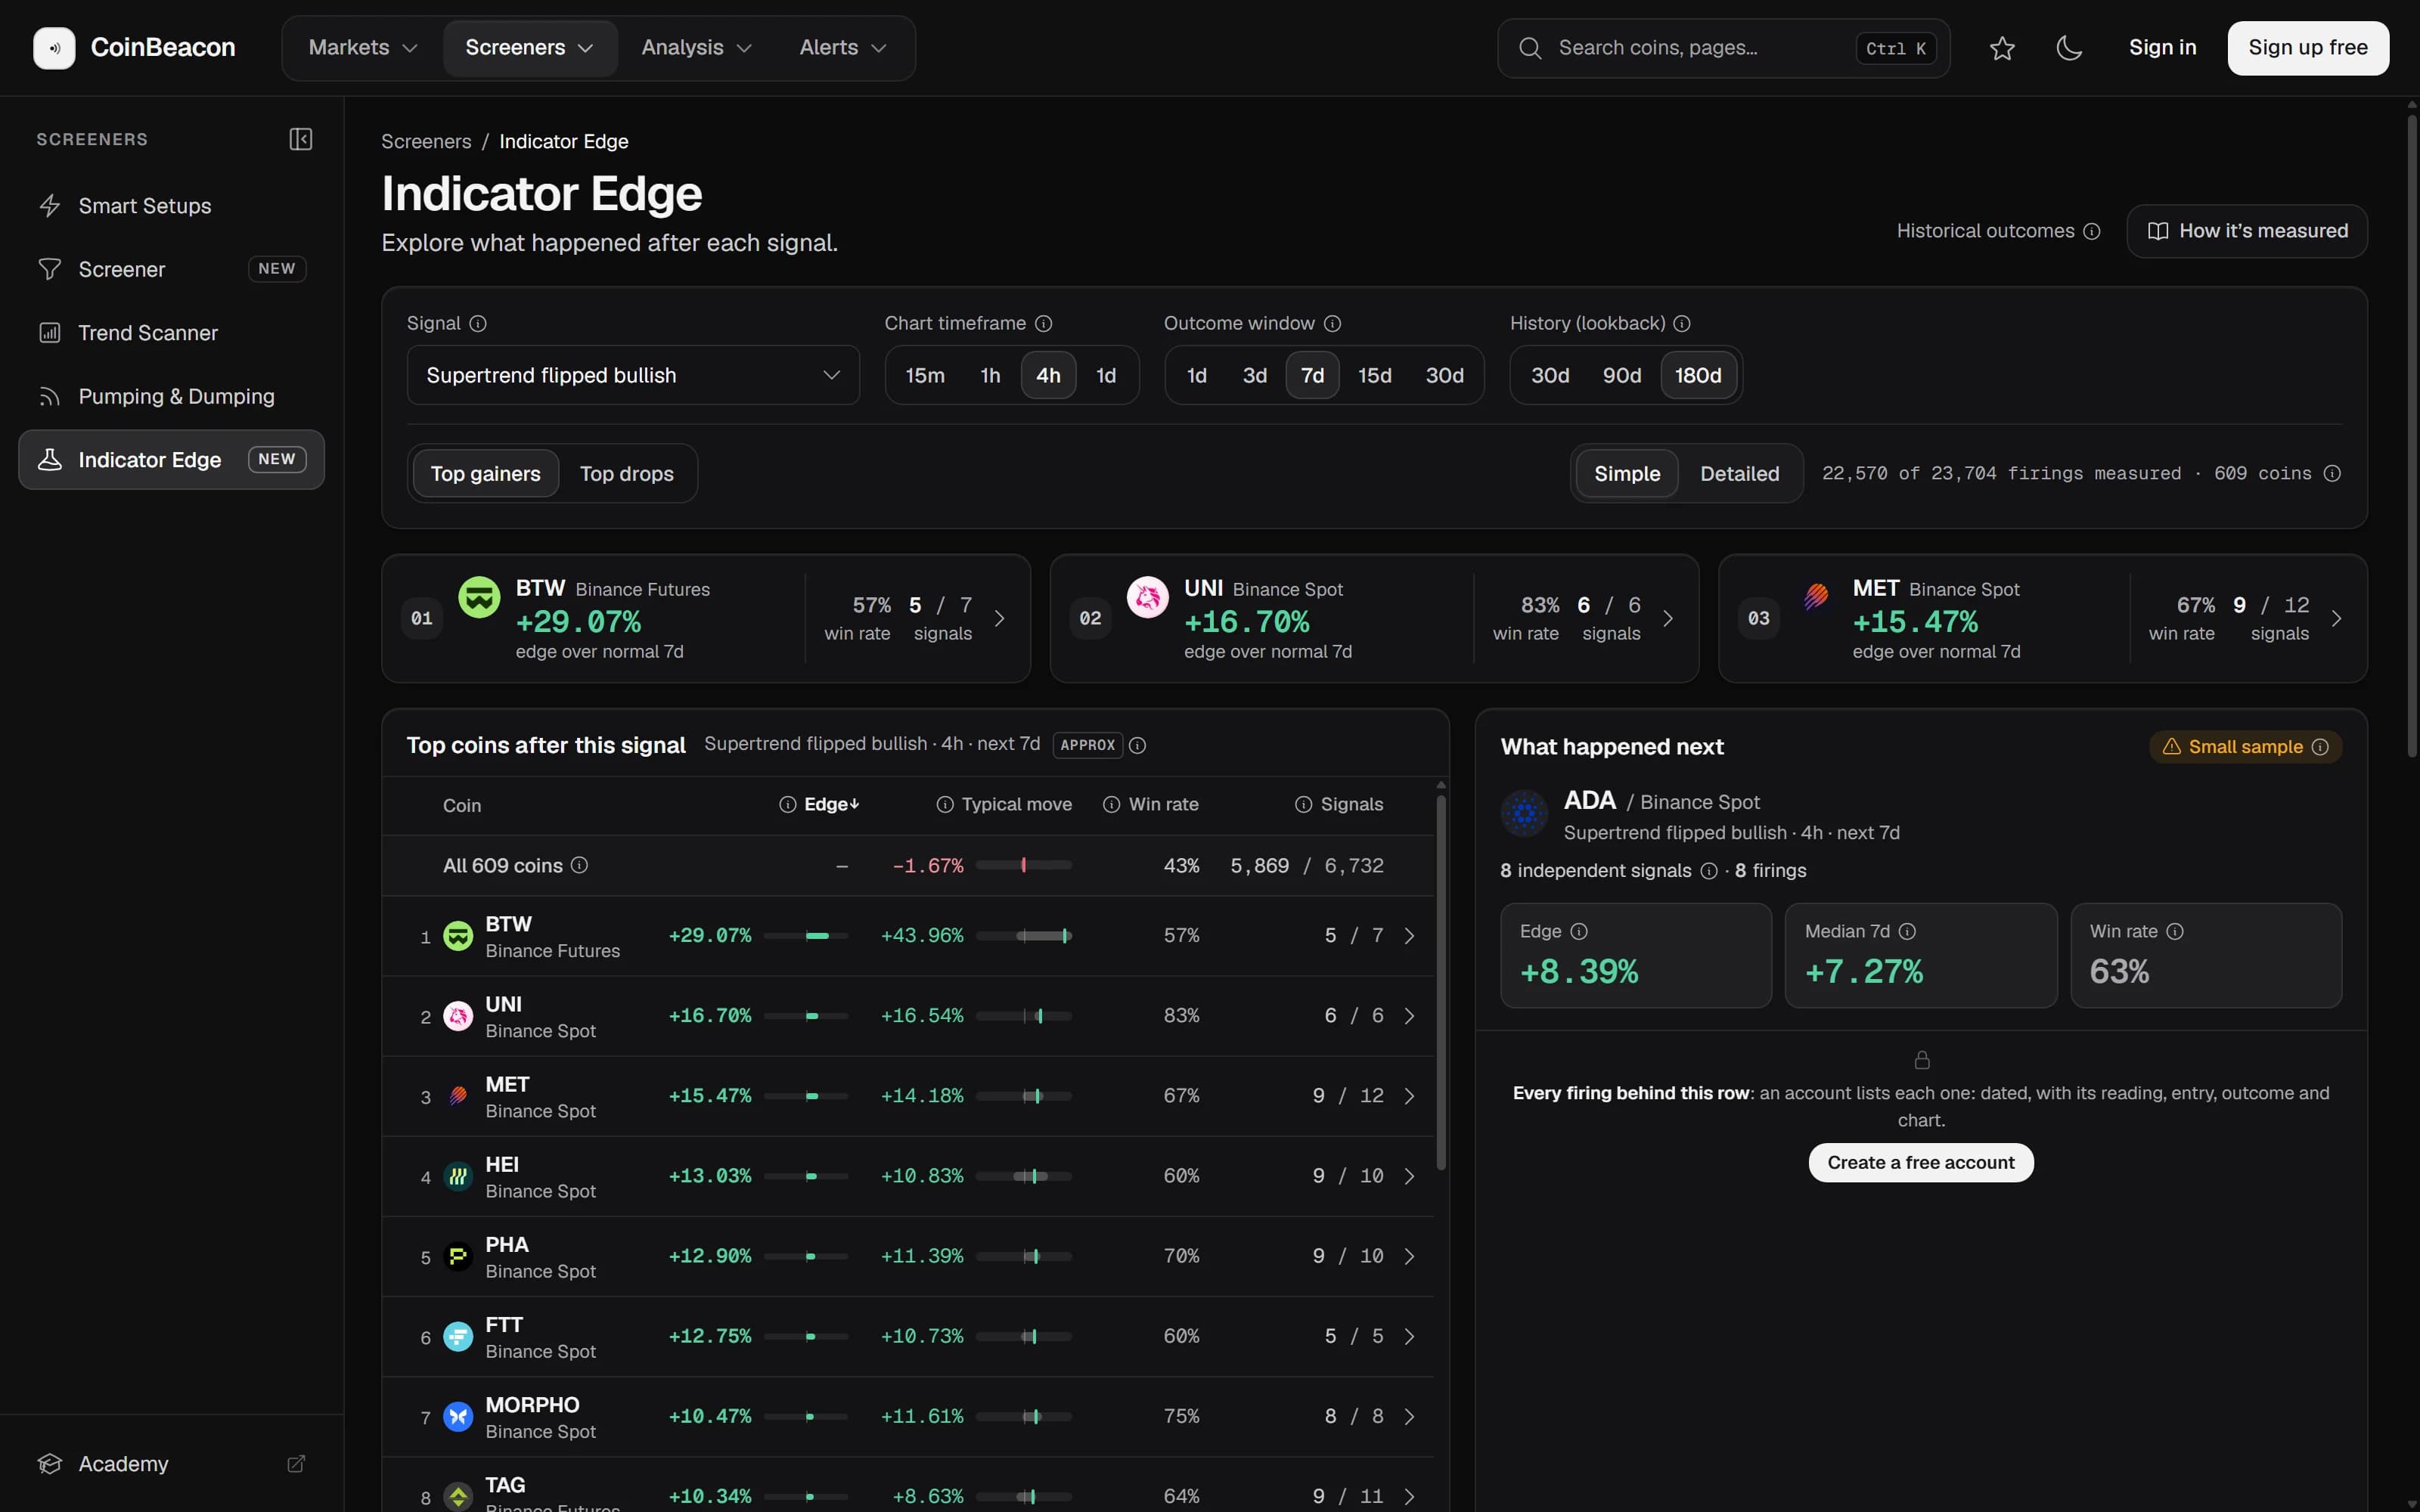
- Supertrend. Supertrend flipping bullish or bearish.
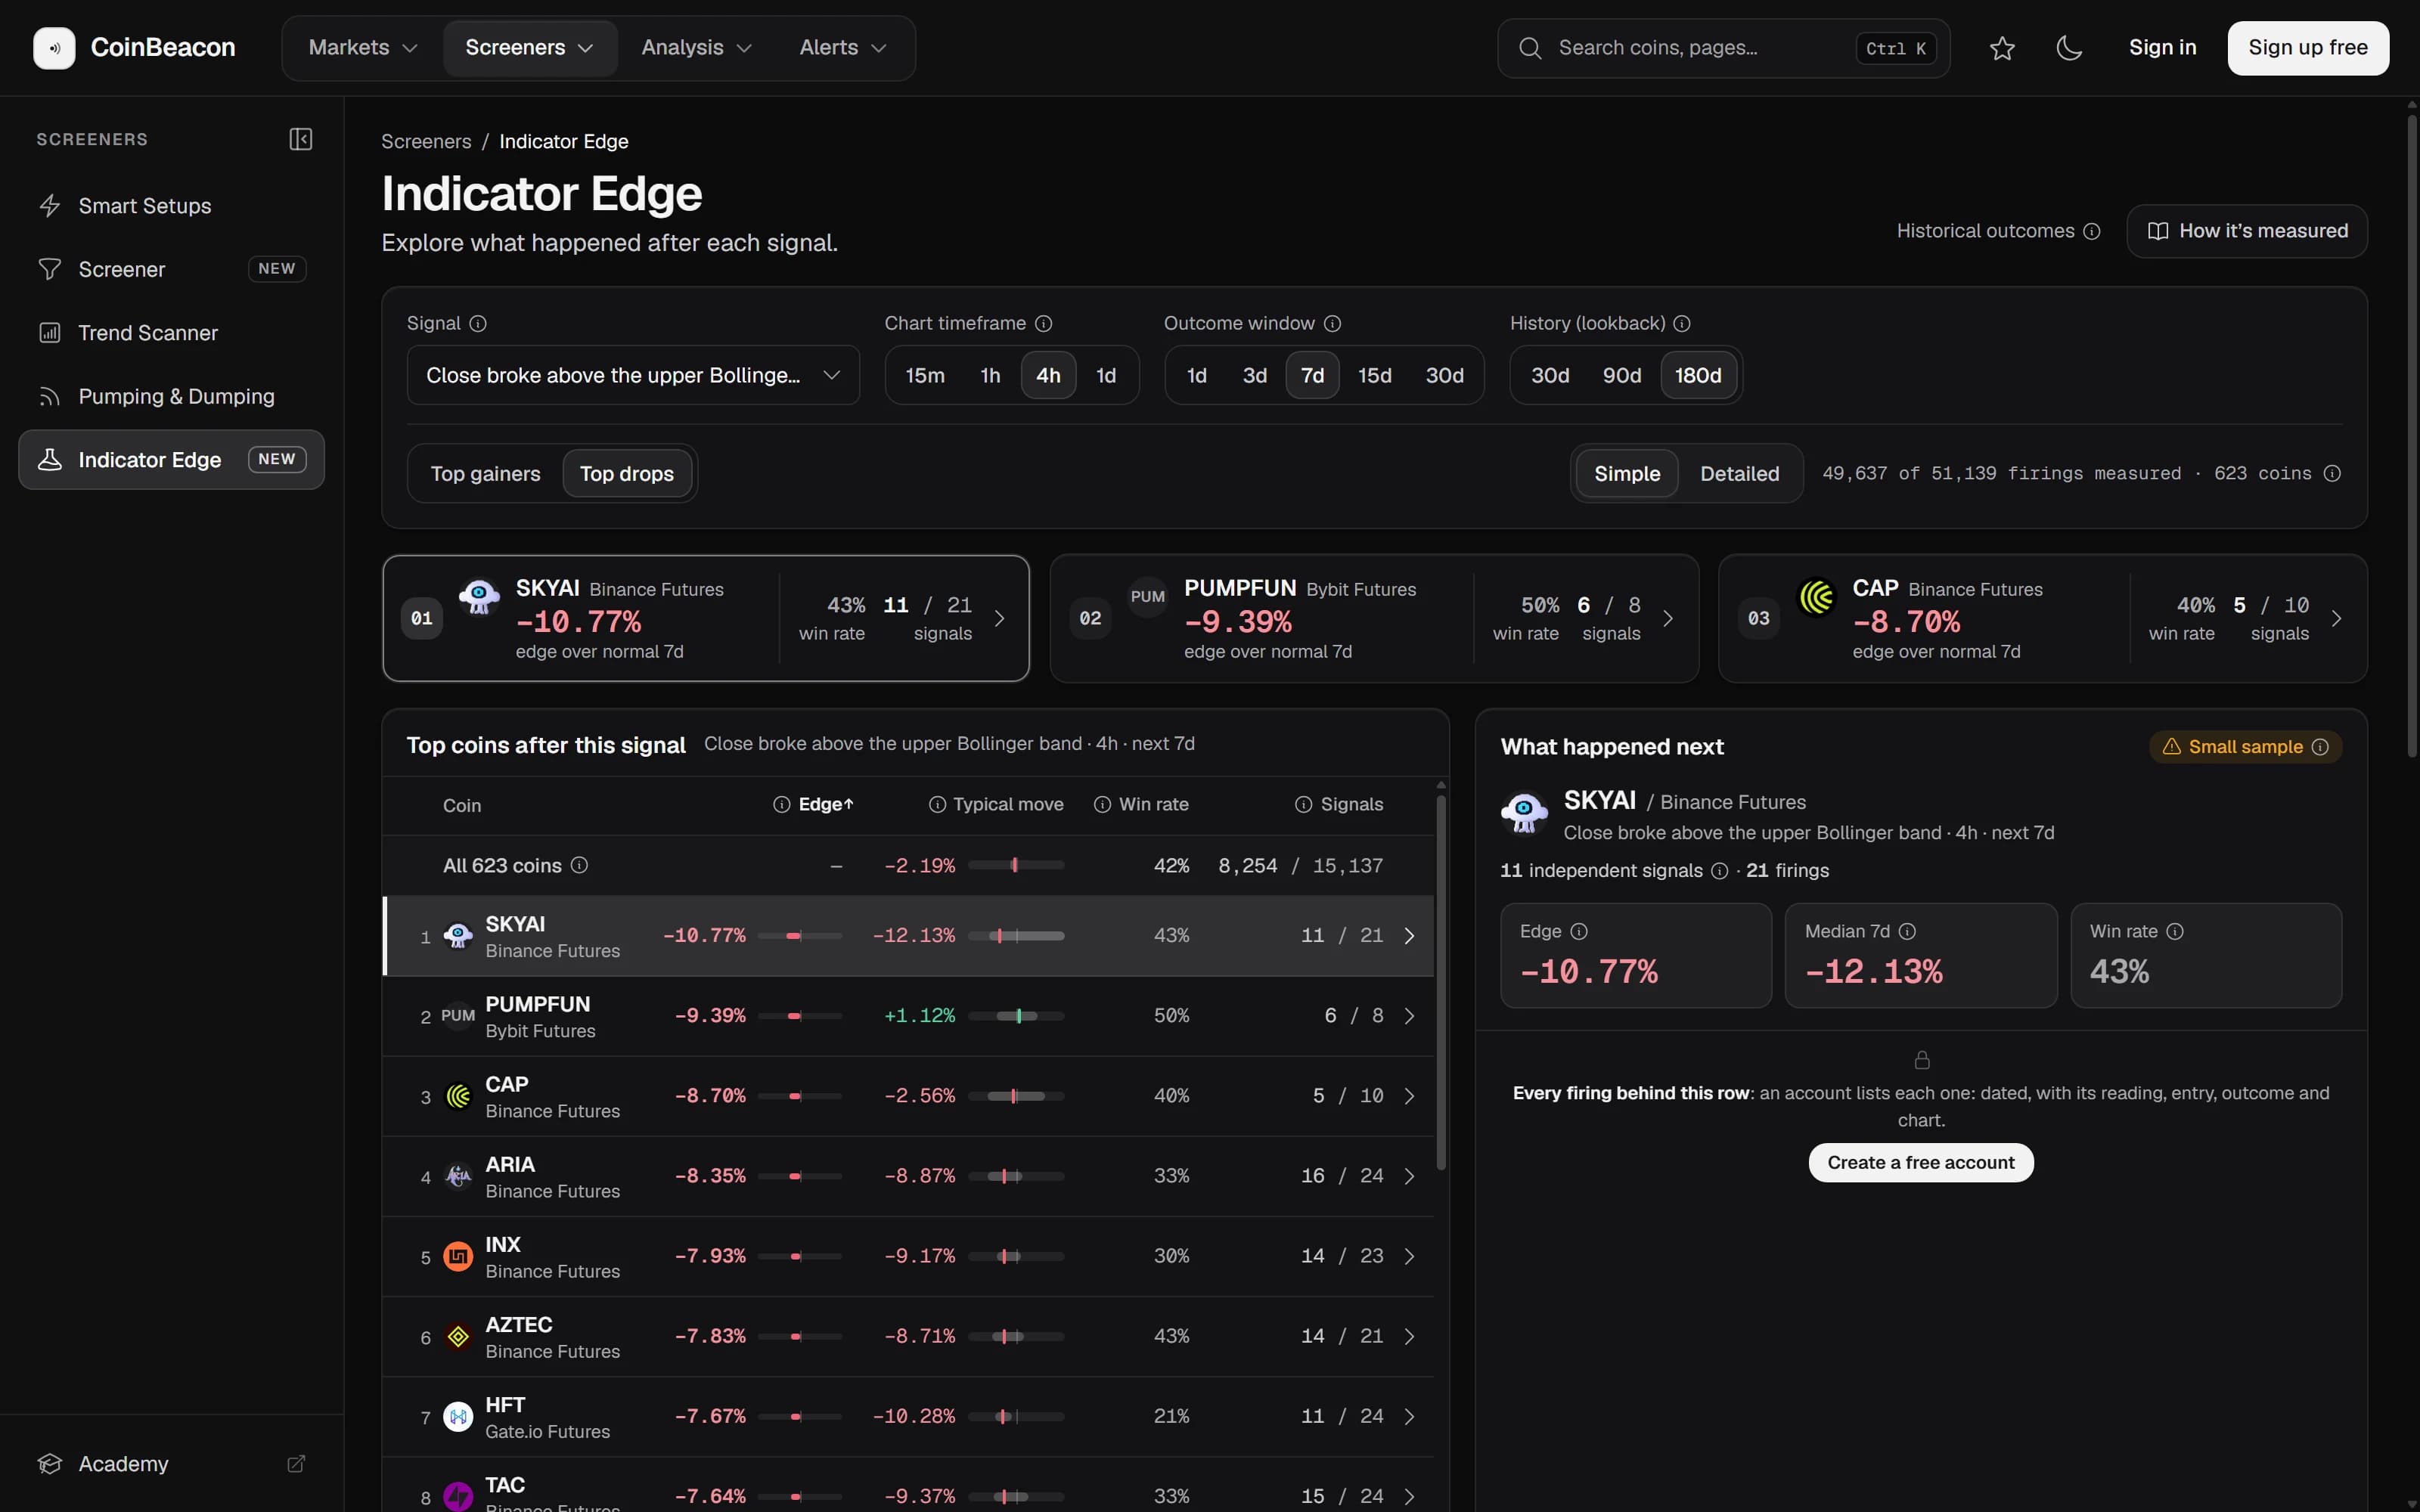
- Bollinger Bands. A close breaking below the lower band or above the upper band.
- Volume. Volume spiking above three times its normal level.
The number beside each event is how many past firings were measured on that timeframe, across every coin. EMA 200 and Supertrend events are marked approx: those indicators carry state from wherever their history began, so a reconstructed reading can differ slightly from a live one on the same candle.
Set the timeframe, window and history
Three more choices complete the question:
- Chart timeframe. 15m, 1h, 4h or 1d. Each timeframe is recorded separately.
- Outcome window. How long after the event to measure: the close that many candles later, against the close of the candle the event fired on. On the 4-hour chart that is 1, 3, 7, 15 or 30 days.
- History. How far back to count firings: 30, 90 or 180 days, or 7 and 14 days on the 15-minute chart, whose candles are kept for about a month.
A window too long for the history you picked is greyed out, with the reason beside it. The line on the right says how many firings in the history had a closed window, out of all of them, and how many coins have enough to rank: at least five independent events, unless you lower the minimum.
Read the ranking
The three leaders sit above the ranking, and the ranking lists every coin that qualifies. Its columns:
- Median move. The middle of the coin’s moves over the window after the event.
- Vs usual move. The median move minus the coin’s usual move over a window of the same length, measured from every candle in its stored history. A coin that rises anyway gets no credit for rising. The ranking is sorted by this column.
- Closed higher. How often the coin ended the window higher than where the event fired.
- Events. Independent events, then every firing. One drawdown can push RSI under 30 several times over almost the same candles, so firings whose windows overlap count once.
A coin with fewer than 20 independent events is marked as a small sample, and its Closed higher figure is greyed out: one more firing can move a small sample a lot. The first row, All coins, combines every coin that qualifies. Read each coin against it, because the top of any ranking can look impressive by chance alone.
Events that expect a fall
Each event points one way: RSI crossing below 30 is read as a possible rise, RSI crossing above 70 as a possible fall. Pick an event that expects a fall and the ranking turns to Top drops, led by the coins that fell furthest compared with their usual move. Top gainers and Top drops switch it back and forth for any event. The RSI guide, MACD, Supertrend and moving-average guide and Bollinger Band guide look at these events across every coin at once.
Open a coin
Select a coin and What happened next shows its own figures: Vs usual move, the median move and Closed higher, with its independent events and firings. With a free account, every firing behind those figures is listed, newest first, with its date, the indicator’s reading, the close it is measured from and its move over the window.
Pick a firing and it is drawn on the chart:
- The candle it fired on, marked with the reading, such as fired · 26.1.
- The event close, the close every move is measured from, drawn as a line.
- The measured window, shaded, ending at the move after it, such as after 7d · +12.5%.
- The indicator itself, in its own pane with its level, such as RSI with the 30 line.
Previous and Next step through the coin’s other firings. A firing’s status says whether longer windows are still being tracked (Partial), all of them have closed (Final), or tracking stopped early (Expired); the windows it completed still count.
Detailed view and the event cards
Detailed view adds the coin’s usual move itself (Baseline), the middle half of its results around the median, the run-up inside the window, its best and worst single results, and when the event last fired. Signed in, you can also lower the minimum number of independent events to see thinner samples.
Further down, every event has a card: how many firings were measured and the coin that leads its ranking. Pick a card to rank that event. A card’s leader needs at least three independent events, so it can name a different coin from the ranking above.
With and without an account
Signed out, you can:
- Pick any event, timeframe, window and history. All 19 events on all four timeframes.
- See the top 20 coins. With the three leaders, the All coins row and each coin’s figures.
- Use the event cards and the Detailed view. Every card, and the extra columns.
A free account opens the full ranking, coin search, venue pinning, the minimum-events setting, and every firing behind each row, each on its chart. An indicator alert can then watch the coins you choose for the next event.