How to find the top crypto gainers and losers with Price Movers
Jordan Ellis
Senior Product Marketing Manager, CoinBeacon
Price Movers ranks every market on one exchange by how far its price has moved over a window you choose, with the 20 biggest gainers on one side and the 20 biggest losers on the other. The film above walks through the whole board, and this page covers the same ground in writing.
What the board shows
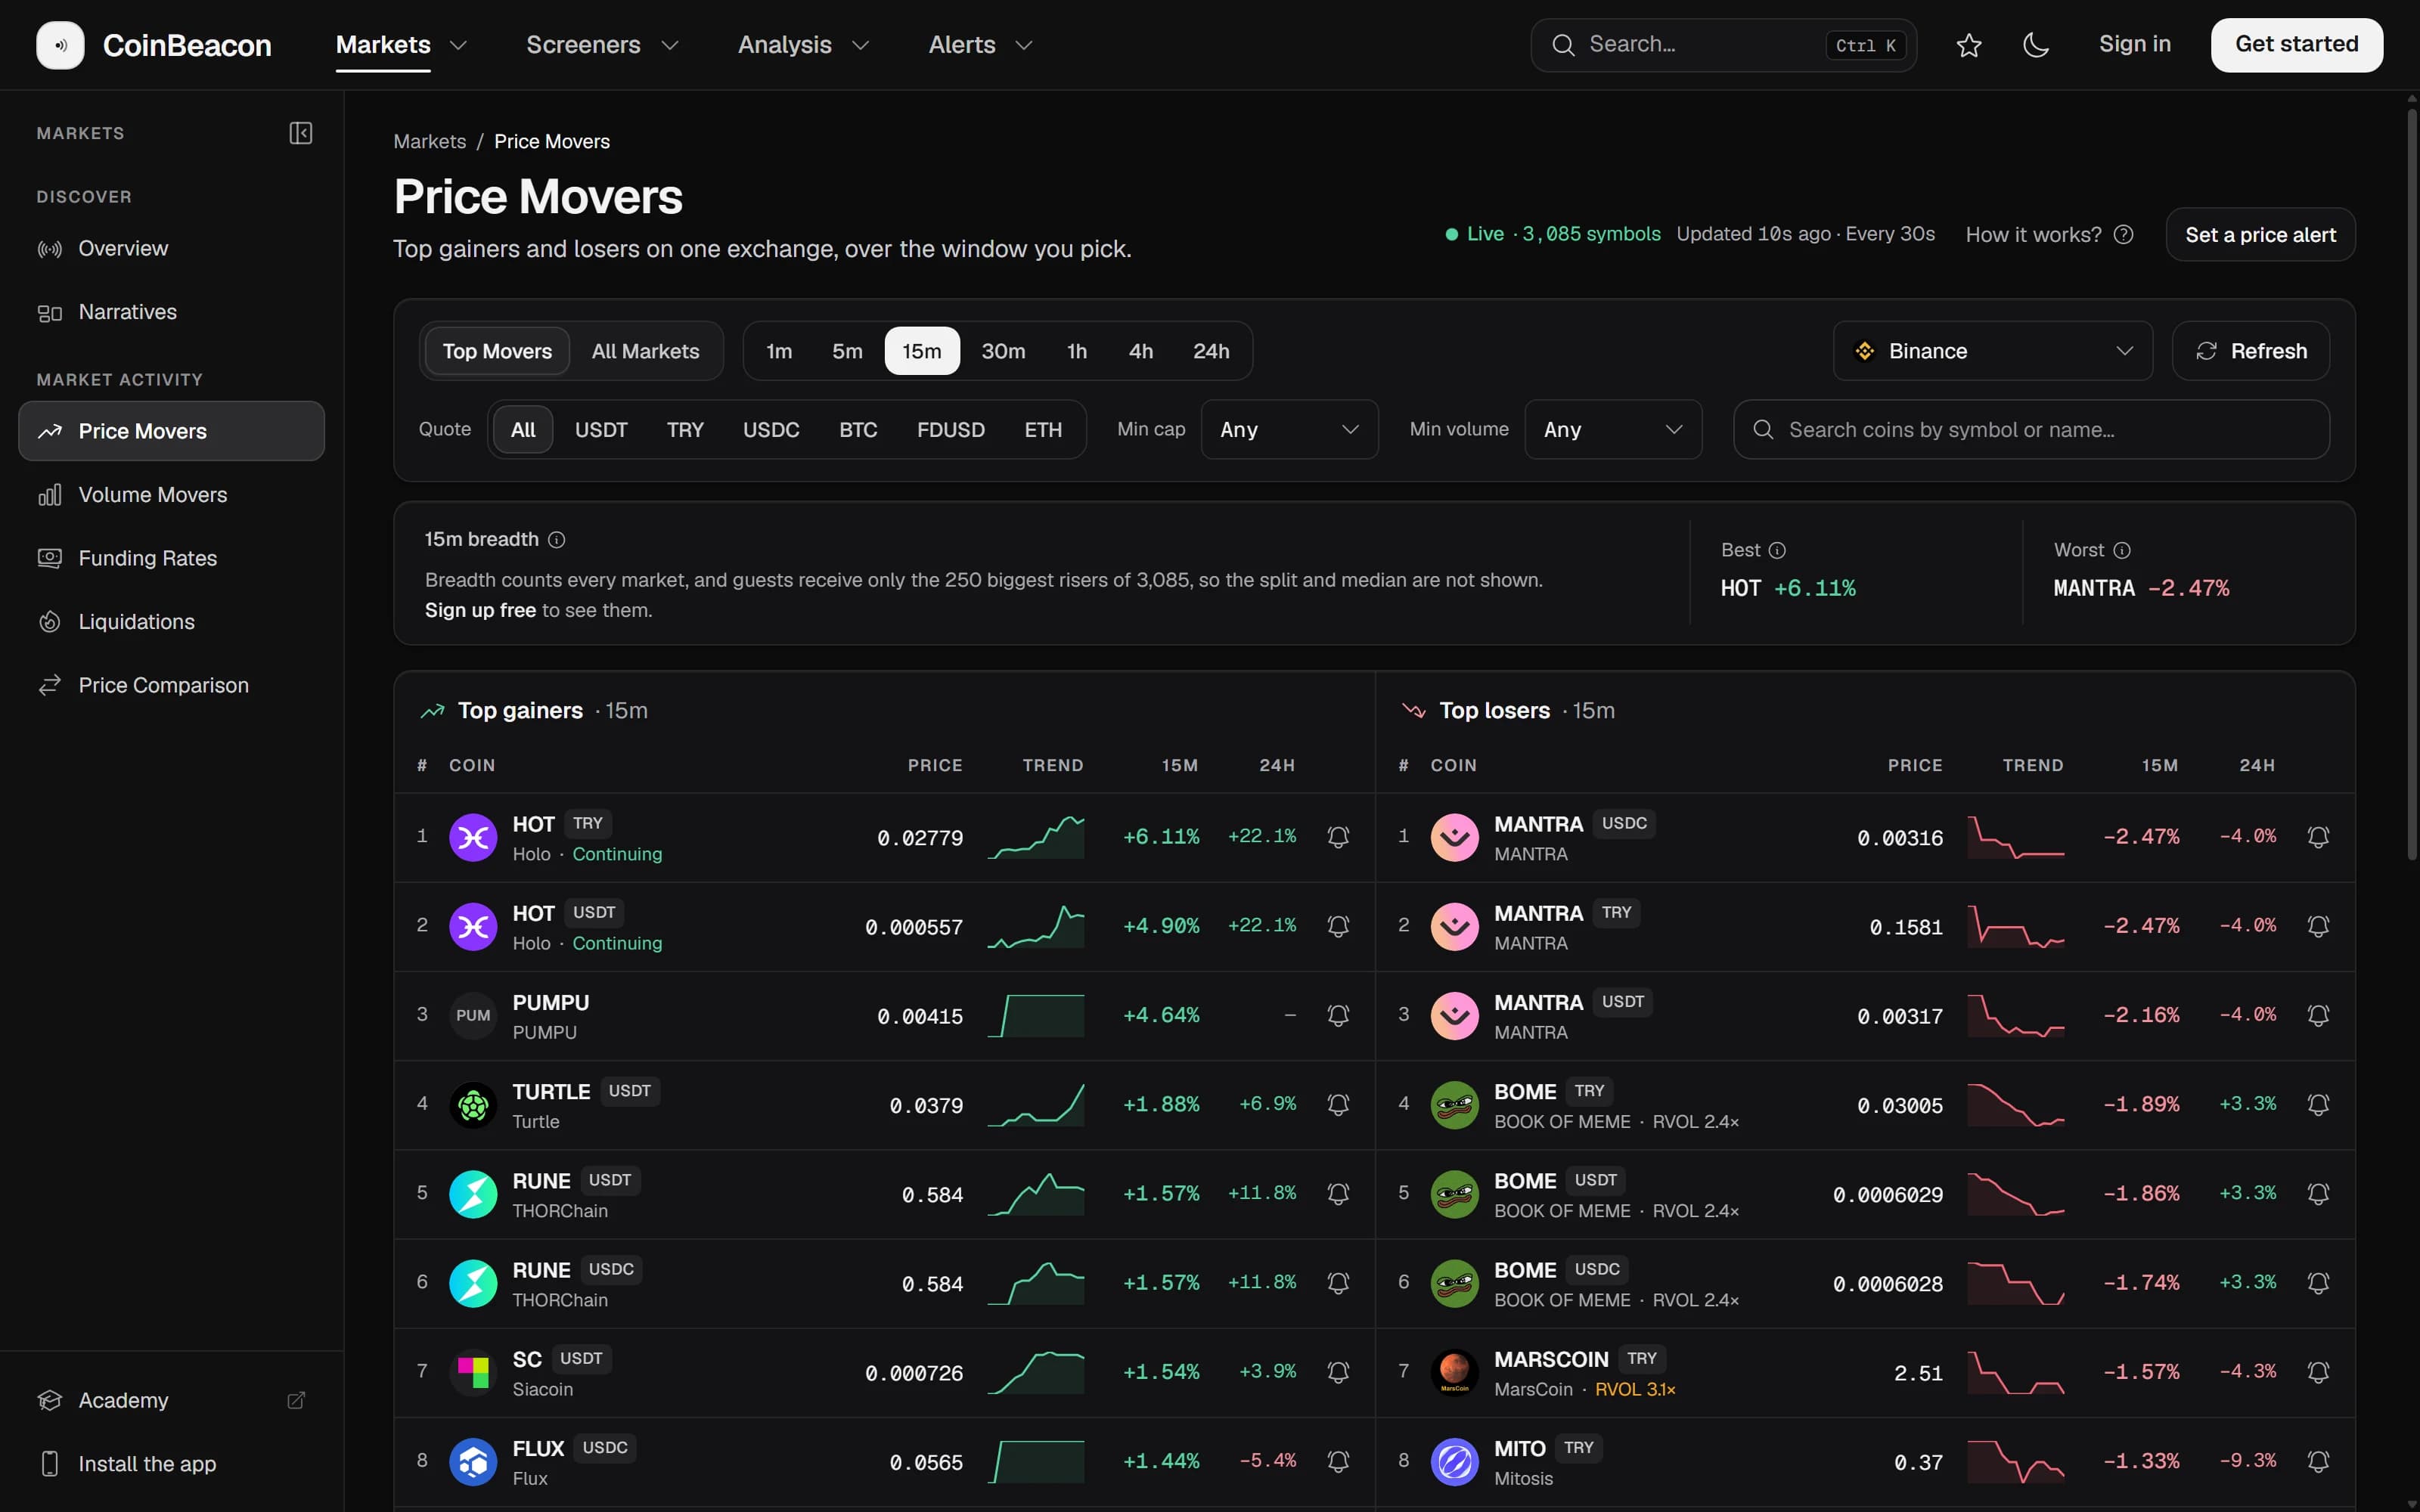
In the app, Price Movers is under Markets. It opens on Top Movers: gainers on the left, losers on the right, each list ranked by percentage change over the window. A row is a market, not a coin, so the same coin can appear once for each quote currency it trades against.
Pick a window and an exchange
The window buttons run 1m, 5m, 15m, 30m, 1h, 4h and 24h. Short windows catch a move as it starts; long ones show where the day has gone. The lists can disagree: a coin can lead the 1-hour list and still be down on the day, which the 24h column on its row shows straight away.
The exchange menu picks one venue, and the board ranks that venue’s own prices. It covers 14: spot markets on Binance, Bitget, Bybit, Coinbase, Gate.io, Huobi, Kraken, KuCoin, MEXC and OKX, and perpetual futures on Binance, Bybit, Kraken and OKX. Prices differ a little from one exchange to the next, so the same coin can rank differently on each; the guide to price differences between exchanges explains why.
How the board updates
The board refreshes every 30 seconds, and pauses while its tab is hidden. After each refresh, an arrow beside a coin shows how many places it climbed or fell, and New marks a coin that was not on the list last time. The status above the board says when it last updated, and Refresh fetches at once.
Reading a row
Each row gives the last price in its quote currency, a trend line over the window, the change over the window, the change over 24 hours, and a bell. On the 1m and 5m windows the trend line covers the last 30 minutes, because one to five minutes of prices has no shape to draw.
Under a coin’s name, up to three tags appear, and only when they are notable:
- RVOL 2.4× is relative volume. The last 15 minutes traded 2.4 times this market’s normal amount. It shows from 1.5× up, on Binance spot and the Binance, Bybit and OKX futures, where CoinBeacon records candles.
- Funding +0.07% is the perpetual's funding rate. It is shown per 8 hours on futures venues, once it reaches ±0.05%. Positive means longs are paying shorts; negative means shorts are paying longs. The funding guide covers what the number means.
- Continuing or Exhausted comes from the pump and dump scanner. Continuing means the latest candle is still pushing in the direction of the move; Exhausted means the extreme was rejected. It only appears when the scanner’s read matches the row’s side, and the pump and dump guide gives its rules.
Is the whole market moving?
Above the lists, the breadth strip counts how many markets on the venue rose, stayed flat and fell over the same window, with the median move and the single best and worst market. It answers the question a leaderboard cannot: is the whole market moving, or just this coin? Ten coins up 8% mean one thing when the median market is up 3% and another when it is down 1%.
Signed out, the strip shows the best and worst market only. A signed-out board receives the 250 biggest risers, which is not enough to count everything else.
Filters and All Markets
- Quote keeps one quote currency. All, or one of the venue’s most traded quotes, such as USDT, USDC or BTC.
- Min cap hides small coins. Any, $1M, $10M, $50M, $100M or $1B of market cap.
- Min volume hides thin markets. Any, $100K, $500K, $1M or $10M traded in 24 hours.
- Watchlist keeps the board to your coins. It appears once you are signed in and have a list.
- Search finds a coin. By ticker or by name.
The All Markets tab swaps the two top-20 lists for every ranked market on the venue, 50 to a page, sortable in either direction. Signed out, it stops at the 250 biggest risers.
From a row to an alert
Select a row and its details open below the tables. On the four exchanges with candles there is a price and volume chart that starts before the window, with the window’s opening price drawn as a dashed line, and the high, low and volume over the chart’s span. Every venue shows the 24-hour change, RVOL and funding where they apply, and how the move was measured: the window’s first and last price.
From there, Full chart opens the coin on CoinBeacon’s charts, Compare exchanges sets its price against other venues, and on a perpetual, Funding opens that contract on the funding rates board. Create alert, like the bell on each row, opens a price alert already filled in with the coin, the exchange and the quote, so you can stop watching the board and be told when the price gets where you care about.
With and without an account
The board is free either way. Signed out, you get:
- Nine exchanges. Binance, Bybit, Coinbase, Gate.io, KuCoin and OKX spot, and the Binance, Bybit and OKX futures.
- Every window and both top-20 lists. With the signals on each row and the detail panel.
- A shorter All Markets and breadth. The 250 biggest risers, and the best and worst market.
A free account adds the other five exchanges, every market in All Markets, the full breadth split and median, and the watchlist filter.